PIVOTING AN INVENTORY
One aspect of data wrangling is making sure the raw data is cleaned up and organized into a form that can be easily analyzed. This organized data should also be easy to work with to answer the questions being asked about the data. A pivot table is a tool that can quickly summarize a large data set. Pivot tables also have the ability to present several completely different views of the data.
Suppose the inventory manager of a garden center was asked to create a report on the current inventory of blueberry bushes. She wasn't provided a specific question to answer, so she created the following two pivot tables to spark conversation about the current inventory.
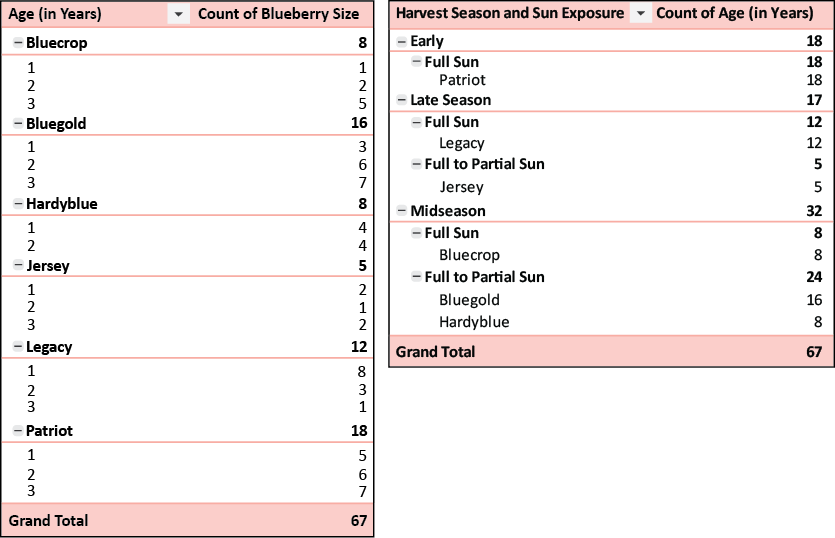
| Age (in Years) | Count of Blueberry Size |
|---|---|
| -Bluecrop | |
| -Bluegold | |
| -Hardyblue | |
| -Jersey | |
| -Legacy | |
| -Patriot | |
| Grand Total |
| Harvest Season and Sun Exposure | Count of Age (in Years) |
|---|---|
| -Early | |
| -Full Sun | |
| Patriot | |
| -Late Season | |
| -Full Sun | |
| Legacy | |
| -Full to Partial Sun | |
| Jersey | |
| -Midseason | |
| -Full Sun | |
| Bluecrop | |
| -Full to Partial Sun | |
| Bluegold | |
| Hardyblue | |
| Grand Total |
-
Describe the information presented in the pivot table on the left.
-
Describe the information presented in the pivot table on the right.
-
What information is displayed in both tables?
-
How many different varieties of blueberry bushes does the garden center sell? What varieties do they have?
-
Which blueberry bush varieties require full sun?
-
Write a question that the pivot table on the left would answer.
-
Write a question that the pivot table on the right would answer.
-
Suppose the inventory manager is given the following question right before the meeting: "What is the age of each blueberry bush in stock and when is the harvest season for each?" Describe how she could create a pivot table to answer this question.