All Section Projects


Section 1.1 Project

THE LOGIC OF NONOGRAMS

In Section 1.1, you learned about solving problems using logic and you explored a variety of situations and a logic puzzle. Another type of logic puzzle is the nonogram. Nonograms are picture logic puzzles and were created by Non Ishida in 1987. A beginner level 6 x 5 nonogram is shown here.

1 1 5 1 4 1
1
5
1 1 1
1 1
1 1
1 1

The numbers across the top and along the side indicate how many squares in the columns or rows should be shaded to solve the puzzle. For instance, the 5 in the first row indicates that 5 consecutive squares should be shaded in that row. A space between numbers indicates that there is a gap of at least one square between the consecutive shaded squares. For instance, 1 1 indicates that there are two single shaded squares that are separated by at least one empty square. When a nonogram is solved, the solution creates a picture.

There are several ways to approach solving these puzzles, but we'll only cover a few in this project. As you answer the questions, shade any squares you are confident about in the puzzle. If you know a cell will not be shaded, you may place an X in that square.

  1. While we can start anywhere with solving this puzzle, we'll start with the largest numbers. The third column indicates that 5 consecutive squares should be shaded. Can we guarantee any of the squares in this column will be shaded? Explain your reasoning.

  2. The top row indicates that 5 of the 6 squares in the row should be shaded. Since the 5 shaded squares are consecutive, which squares can we guarantee will be shaded? Explain your reasoning.

  3. The second row indicates that there are three single squares shaded with at least one empty square between each. What is the minimum number of consecutive squares that are needed to complete the indicated pattern? With the information we have so far, which squares in this row can we guarantee will be shaded? Explain your reasoning.

  4. Continue solving the puzzle, explaining your steps as you go. (Hint: Look at the column with 4 shaded squares next.)

  5. Describe the shape created by the shaded solution.

  6. Now that you know the basics of solving nonograms, solve one of the following slightly harder puzzles. As you work, describe the logic you used to determine which squares are shaded. Then, describe the shape created by the shaded solution.
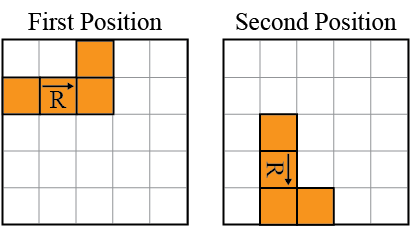
    Option 1
    4 1
    4
    8 2 5
    1
    1
    1
    1
    1
    3
    1
    1
    1
    1
    1
    1
    1
    3
    1
    1
    1
    7
    1 1 5
    3 1 1
    1 1 1 2 1
    3 1 1 1 1
    2 1 1 1 1
    2 1 1 1
    2 3 1
    2 1
    7
    Option 2
    1
    2
    4 1
    6
    7 1
    3
    3 3 7 1
    2 2
    3
    2 1 2
    4 1
    6
    6
    6
    1 1
    1 1

Section 1.2 Project

ESTIMATING TUNERS AND TOILETS

The physicist Enrico Fermi once asked a class of students to estimate the number of piano tuners in Chicago. We'll walk through the same estimating process that he used to solve this problem. For each step, explain your thought process for the estimate or calculation. Do not look up any values during this project. Use your reasoning skills to estimate at each step along the way.

  1. Suppose the city of Chicago has approximately 3 million people living in it. From this value, estimate how many households are in Chicago. (Hint: First estimate how many people are in a household.)

  2. Estimate how many households in Chicago own a piano. Using this estimate, determine how many pianos are likely to exist in Chicago.

  3. Next, estimate how often the average piano owner has their piano tuned per year.

  4. Now, consider how many pianos a single piano tuner can tune per year. Assume that it takes an hour to an hour and a half to tune a piano. (Hint: Would the piano tuner work every day of the year? How much travel time might the tuner need between appointments?)

  5. Use the estimates and educated guesses you've made so far to make one final estimate: how many piano tuners are in Chicago?

  6. Now, use a similar thought process to estimate the number of restrooms the Pentagon has knowing the following information: the Pentagon has 7 floors and houses approximately 27,000 employees. Explain your entire thought process and how you arrived at the final number.

  7. Compare your estimates to the estimates of other people in your class. Are the estimates similar? What assumptions might have resulted in answers that are not similar?


Section 2.1 Project

THE DEDEKIND INN: THE STRANGE CASE OF SETS WITH LARGE CARDINALITY

In Section 2.1, you learned about cardinality and how it represents the number of elements in a set. In this activity, you will explore this idea a little further and investigate the cardinality of a very large set.

Let's start by refreshing our memory. Consider the set of colors of the rainbow, X.

X = Red Orange Yellow Green Blue Indigo Violet

Also consider the set of days of the week, Y.

Y = Sunday Monday Tuesday Wednesday Thursday Friday Saturday

  1. What is the cardinality of set X?

  2. What is the cardinality of set Y?

These two sets are said to be equipotent because they have the same cardinality; that is, we can match each element of set X with a unique element of set Y in what is called a one-to-one correspondence. Every element of X is matched to one unique element of Y and every element of Y has a unique match in X. No element in Y is matched to more than one element in X. Here is one possibility of the matching between the sets.

X Y
Red Sunday
Orange Monday
Yellow Tuesday
Green Wednesday
Blue Thursday
Indigo Friday
Violet Saturday
  1. Find a different one-to-one correspondence between the two sets.

    X Y
    Red   
    Orange   
    Yellow   
    Green   
    Blue   
    Indigo   
    Violet   

It may surprise you, but we use this idea all the time without even thinking about it! For instance, if a hotel has 100 rooms and they are all full, the hotel can't accept another guest. There is no one-to-one correspondence between the set of rooms (the cardinality of which is 100 ) and the set of potential guests (the cardinality of which is 101 ).

Now, imagine a hotel called The Dedekind Inn1. This is a strange place with a lot of rooms. In fact, there is one room for each natural number. There is a Room 1, a Room 2, a Room 3, and so on, never ending.

A row of six doors labeled sequentially one to six and implied to continue

Suppose that the hotel is completely full, and a new guest arrives and requests a room.

  1. Would the hotel be able to accommodate the new guest? Why or why not?

Imagine that now management asks every current guest to move to the next room over; that is, the guest in Room 1 moves to Room 2, the guest in Room 2 moves to Room 3, and so on.

  1. After this shuffling of guests, which room is now open and ready to receive the new guest? Where did the extra room come from?

Now, suppose that management needs to empty half of the rooms for cleaning. They ask each guest to move to the room whose number is twice their current one.

Two rows of doors

The same row of doors for the previous image. Each door has an arrow pointing to a door in a second row. The doors in the second row are labeled two, four, six, eight, ten, and twelve, two times the label of the door from row one that points to it.

After this rearrangement, every odd room is empty and cleaning can be done in those rooms.

  1. What kind of correspondence have you constructed between the set of natural numbers, = 1 2 3 4 5 , and the set of positive even integers, E = 2 4 6 8 10 ? Create an expression to describe the correspondence between the two sets.

  2. What does your answer in part 6 say about the cardinality of the two sets and E? Are you surprised? Explain.

  3. What can you say about the correspondence of the set of natural numbers and the set 3 6 9 12 15 ?

1   Julius Wilhelm Richard Dedekind (October 6, 1831 to February 12, 1916) was a German mathematician considered one of the fathers of modern set theory.


Section 2.2 Project

ONES, ZEROS, AND THE NUMBER OF REGIONS IN A VENN DIAGRAM

A computer chip is basically a collection of transistors, which are electronic components that work as switches. A transistor can be in one of two states: on or off. In computer engineering, the number 1 is used to represent the on state while 0 is used to represent the off state. Numbers composed only of zeros and ones are called binary numbers.

In this activity, you will investigate the relationship between binary numbers and the regions of a Venn diagram. Consider the one-set Venn diagram in Figure 1. We have labeled each region of the diagram by asking the question, "Does this region contain elements of set A?" If the answer is yes, we labeled the region with (1); if the answer is no, we labeled the region with (0). Table 1 shows a summary of the regions.

A rectangle labeled (0). A circle within the rectangle is labeled A and (1).
Figure 1: One-Set Venn Diagram
Table 1: Regions in Figure 1
Elements of Set A? Region
Yes (1)
No (0)

As you can see, we have exactly 2 regions: (1) and (0). We are labeling the Venn diagram using single digit binary numbers. Let's use the same idea to label a two-set Venn diagram. (Note that some regions in the figures may end up containing no elements when actual sets are considered, but the diagrams take into account all possible regions when considering the relationship between a fixed number of sets.) The region in Figure 2 that contains no elements of set A but some of the elements of set B is labeled (10), and the region that contains no elements of set B but some of the elements of set A is labeled (01). This time, we are labeling the Venn diagram using two-digit binary numbers.

A rectangle labeled (00) with two intersecting circles inside. One first is labeled A and (01) and the second circle is labeled B and (10).
Figure 2: Two-Set Venn Diagram
Table 2: Regions in Figure 2
Elements of Set B? Elements of Set A? Region
No No (00)
No Yes (01)
Yes No (10)
Yes Yes
  1. Write 2 , which is the number of regions in Figure 1, as a power of 2 . In other words, 2 raised to what power is equal to 2 ?

  2. In Figure 2, what should be the label for the intersection of set A and set B, the region that contains elements that are both in set A and in set B at the same time?

  3. How many regions are in Figure 2? Write this value as a power of 2 .

  4. Complete Table 3 and label the three-set Venn diagram in Figure 3 using the same process we used with the one-set Venn diagram and the two-set Venn diagram. For this Venn diagram, you will work with three-digit binary numbers.

A rectangle labeled (000) with three intersecting circles inside. One first is labeled A and (001), the second circle is labeled B, and the third circle is labeled C. The intersection of circles A and B is labeled (011). The intersection of circles B and C is labeled (110).
Figure 3: Three-Set Venn Diagram
Table 3: Regions in Figure 3
Elements of Set C? Elements of Set B? Elements of Set A? Region
No No No (000)
No No Yes (001)
Yes No (010)
Yes Yes (011)
(100)
Yes No Yes
Yes Yes No
Yes Yes Yes
  1. How many regions are there in Figure 3? Write the number as a power of 2 .

  2. How do you determine the number of regions in a Venn diagram for a fixed number of n sets?

  3. Without drawing a diagram determine the number of regions in a four-set Venn diagram.

  4. List all regions for a four-set Venn diagram using four-digit binary numbers. (Hint: Notice that in Tables 1, 2, and 3, if a region contains elements of set A, then the rightmost digit of the region is 1. Look for similar patterns.)


Section 2.3 Project

EXPLORING INTERVALS: INTERSECTIONS AND UNIONS

In Section 2.3, you learned about the intersection and union of sets. In this activity, you will investigate intersections involving sets that cannot be described using roster notation.

Consider the set I 1 of all real numbers that are greater than or equal to 0 and less than or equal to 1 . Using set-builder notation, we have I 1 = x 0 x 1 , which we can also represent using interval notation as I 1 = 0 1 or graphically as shown in Figure 1.

Numberline I1
Figure 1

Now, for each natural number n, that is n = 1 2 3 4 , we can think of the interval I n = 0 1 n .

For example, I 3 = 0 1 3 is the set of all real numbers greater than or equal to zero and less than or equal to 1 3 .

  1. Determine I 1 I 2 .

  2. Determine I = I 1 I 2 I 3 .

  3. Determine I = I 1 I 2 I 3 I 4 .

This sequence of intervals is called nested intervals, where each set in the sequence is contained within the previous one. This means that the intersection of the nested intervals is equal to the smallest interval.

Let's see what happens if we keep going with taking intersection forever.

Let's consider

I = I 1 I 2 I 3 I 4 ,

which is the intersection of all such intervals. If a positive number x is in I, then it has to be in every one of the intervals. Let's see if this is possible.

  1. Find an interval of the form 0 1 n that does not contain the number 0.01 .

  2. Find an interval of the form 0 1 n that does not contain the number 0.0001 .

No matter how small of a number you pick, there is always an interval in our list of nested intervals that does not contain the number you picked. We can conclude that no positive number can be in the intersection I = I 1 I 2 I 3 I 4 .

  1. In fact, there is exactly one number in the intersection I = I 1 I 2 I 3 I 4 , What is the number in this intersection? Explain your reasoning.

  2. What is the union J = I 1 I 2 I 3 I 4 equivalent to?


Section 2.4 Project

SET THEORY AND ALLOCATION OF RESOURCES

According to the job interviewing coaches Jeff & Mike The Interview Guys,

Analytical skill is the ability for an individual to solve complex issues by gathering and then analyzing the information that is available to them through a variety of other skills including critical thinking, research, and attention to detail.

In this activity, you will solve a seemingly complex allocation of resources problem by using a mathematical model involving Venn diagrams.

A medium-size tech company has to staff 3 distinct departments: Social Media Outreach (SM), Information Technology (IT), and Web Development (WD). The fast-paced and innovative environment at the company may require an employee to be part of more than one department.

The company has the following staffing requirements.

  • The total number of employees in the three departments must be exactly 40 .

  • There must be exactly 16 employees in Information Technology and exactly 20 employees in Social Media Outreach.

  • No employee can work in Information Technology and Social Media Outreach without also being a part of Web Development.

  • There must be exactly 8 employees working in both Social Media Outreach and Web Development.

  • Exactly 4 employees will be required to work in Web Development and Social Media Outreach but not in Information Technology.

  • Exactly 2 employees work in Information Technology and Web Development but not in Social Media Outreach.

  1. Draw a three-set Venn diagram representing the three departments and their overlap.

  2. Determine the number of employees in each of the regions of the Venn diagram from part 1.

The company decides to add another department named Customer Experience (CE). This department can only share employees with Social Media Outreach.

  1. Draw a four-set Venn diagram that models this situation.

  2. After adding the Customer Experience department, the total number of employees increases from 40 to 50 . Knowing that 6 people work in the CE department only, determine how many employees now work in CE and SM departments at the same time.


Section 3.1 Project

SELF-REFERENCE, BARBERS, ALLIGATORS, AND PARADOXES

As you have learned in Section 3.1, not all sentences in English qualify as statements. There are several ways in which seemingly simple sentences can lead to head-scratching situations. In this project, we will consider three different sentences that do not qualify as statements.

First, consider a barber who operates under the following assumption, which is the barber paradox: The barber shaves all those, and those only, who do not shave themselves.

  1. Suppose that Cristiano, who is not the barber, does not shave himself. Will the barber shave Cristiano?

  2. Arjun, who is also not the barber, shaves himself every morning. Will the barber shave Arjun?

  3. Does the barber shave himself? (Hint: Explore the consequences of answering "yes, the barber does shave himself" and "no, the barber does not shave himself.")

Now, imagine the admittedly bizarre situation where an alligator steals a child and promises the child's safe return if the child's mother can correctly guess what action the alligator will take with the child next: returning the child safely or not returning the child.

  1. How would the alligator respond in the case the mother guesses that the child will not be returned?

Finally, recall the famous tale of Pinocchio, whose nose would grow every time he told a lie.

  1. What happens if Pinocchio says, "My nose grows now"?

The issues you may have encountered while thinking about these situations have to do with the phenomenon of self-reference; these are self-referential statements.

  1. Perform an internet search and find the definition of self-reference.

  2. Explain how self-reference is working in each of the three examples we covered in this project to make them paradoxes.


Section 3.3 Project

THE CASE OF DESCARTES

The French mathematician and philosopher RenĂ© Descartes (1596–1650) famously wrote "cogito, ergo sum," which is Latin for the well-known philosophical statement, "I think, therefore I am." He wrote this sentence when studying a place of deep questioning in the human mind.

Descartes' work is of great importance in Western thinking, and it is widely studied in academia. To lighten their studies up a little, many mathematics and philosophy students are told the following joke.

René Descartes is having dinner and has just finished his drink. The server asks him if he would like another. Descartes replies, "I do not think so," and disappears in a puff of smoke.

While a witty one, the joke's punch line may not be mathematically correct.

  1. Rewrite Descartes' statement as a conditional (if-then) statement.

  2. Let p be the statement "I think" and q be the statement "I am." Complete the truth table.

    p q p q p q p q
    T T
    T F
    F T
    F F
  3. Write the conditional p q as a sentence in English.

  4. Are p q and p q logically equivalent? Explain.

  5. Use your previous answers to explain why the punch line for the joke does not really work.


Section 3.4 Project

QUATERNIO TERMINORUM: ANOTHER INTERESTING TYPE OF FALLACY

In Section 3.4, you learned how to recognize sound deductive reasoning and explored a few different types of fallacies. In this activity, you will explore one more type of fallacy.

Consider this perfectly fine logical argument.

  • All mammals have bones.

  • All cats are mammals.

  • All cats have bones.

This type of argument is known as a syllogism, which means we have exactly three elements: two premises and one conclusion. This syllogism connects the three terms mammals, bones, and cats to reach a logical conclusion.

  1. Identify the two premises and the conclusion in the mammal syllogism.

  2. Construct your own syllogism using the three terms eggs, birds, and parrots.

If we use a fourth term in the conclusion that is not connected by the two premises, we get a fallacy. Consider the following argument.

  • All mammals have bones.

  • All cats are mammals.

  • All fish are mammals.

This is total nonsense, which stems from the fact that the term fish is introduced and is not related to either premise (that is, fish are not a type of mammal). The two premises are not enough to connect the four terms involved. This type of fallacy is known as a fallacy of four terms, or quaternio terminorum.

  1. Create a fallacy of four terms using the premises you created in part 2.

Not all fallacies of this type introduce an obvious fourth term. Consider the feature of the English language that allows a single word to have different meanings depending on how it is used in a sentence. This can lead to a fallacy where multiple instances of the same word actually represent different terms. Here is an example.

  • Nobody is perfect.

  • I am a nobody.

  • I am perfect.

  1. In this argument, a single word appears multiple times and seems to be a single term. Identify this term and explain how the term actually takes on two different meanings.

  2. Write an argument that is a fallacy of four terms using three terms, where one of the terms has two different meanings. Explain what causes your argument fallacy. (Hint: If you are stuck, try to think of a common word that has more than one meaning, like mouse, bat, light, or bright.)


Section 4.1 Project

PROPORTIONS, PERCENTAGES, AND ELECTIONS

Our political system is based on a voting method called the plurality method. In the plurality method, voters are presented with a list of candidates and each voter selects their first-choice candidate. The choice with the greatest number of first place votes is declared the winner.

A small town decided to ask voters to do something slightly different during an election to fill a town council seat: they were asked to rank the four candidates in order of preference, from first to fourth. The following table, called a preference table, summarizes all of the votes that were cast during the election. For example, the first column shows that 540 voters picked Smith as their first choice, Thomas as their second choice, Orlando as their third choice, and Patel as their last choice.

Preference Table for the Town Council Election
540 250 160 140
1st choice Smith Thomas Patel Orlando
2nd choice Thomas Patel Thomas Thomas
3rd choice Orlando Orlando Orlando Patel
4th choice Patel Smith Smith Smith
  1. Determine the total number of voters who participated in this election.

  2. How many voters chose Smith as their first choice? How many chose Smith as their last choice?

  3. What proportion of voters chose Smith as their first choice? What proportion of voters chose Smith as their last choice? Write each proportion as a fraction of the total number of voters, reduced to lowest terms.

  4. What percentage of voters chose Smith as their first choice? What percentage of voters chose Smith as their last choice? Round your answer to the nearest hundredth, if necessary.

  5. According to the plurality method, which candidate should be declared the winner?

  6. Considering the entire preference table, is there anything that strikes you as odd about the chosen winner?

  7. Is there a candidate that would be less polarizing?


Section 4.2 Project

COUPONS, DISCOUNTS, AND SALES TAX

Many retail stores offer shoppers incentives in the form of coupons. Sometimes these coupons are advertised as having the same value as cash, with the disclaimer that they have to be used before taxes. In this activity we will explore the use of such store-cash promotions.

Suppose you have received a coupon for your favorite department store Tohl's. The coupon states that you have 10 dollars' worth of Tohl's bucks that can be used when you spend at least 50 dollars in the store.

You decide to go to Tohl's and purchase four items: two T-shirts, a pair of socks, and a pair of jeans. The prices for these items are recorded in the following table.

Math Rocks T-shirt $ 13.99
Nickelback T-shirt $ 12.99
Pokémon Socks $ 8.99
Levi's 550 Jeans $ 27.99
Total $ 63.96
  1. If you do not use your 10 -dollar Tohl's bucks coupon, what would be your total, considering that the county where the store is located has a 6.75 % sales tax? Round your answer to the nearest cent.

  2. Now assume that there is a sale going on and everything in the store is 15% off. What would be your total without using the $ 10 of Tohl's bucks and with the same 6.75 % sales tax? Round your answer to the nearest cent.

  3. Now, let's investigate what happens if you use the Tohl's bucks coupon. There are two options: the coupon is applied after the 15 % discount or the coupon is applied before the 15 % discount. Fill in the following table to compare the amount due with the two options. Round each calculation to the nearest cent, if necessary.

    Option 1 Option 2
    Total $ 63.96 Total $ 63.96
    15 % Discount Tohl's Bucks $ 10.00
    Tohl's Bucks $ 10.00 15 % Discount
    Total before Tax Total before Tax
    Sales Tax Sales Tax
    Amount Due Amount Due

    Which option do you believe is the one actually used by stores? Explain your reasoning.


Section 4.3 Project

WHICH TIRE IS THE BEST OPTION?

Calculating unit rates can help you make better decisions when it comes time to spend your hard-earned money. For example, dealing with car maintenance can be a frustrating experience. How can a person make an informed decision when replacing tires?

In this project, you will explore the use of unit rates to help you choose a new set of tires for your car.

You have budgeted a maximum of $ 370 for a set of new tires. The following table shows two different brands of tires that would fit your vehicle.

Name Raptor VR Solus TA31
Price per Tire $ 83.26 $ 90.00
Set of 4 Tires $ 333.04 $ 360.00
Mileage Warranty 55,000 miles 65,000 miles
  1. If total cost is your only consideration, which tire is the "best" choice?

  2. The Raptor VR has a 55,000 -mile warranty. Find the rate of miles to dollars for one Raptor VR tire. Write your answer as a unit rate.

  3. The Solus TA31 has a 65,000 -mile warranty. Find the rate of miles to dollars for one Solus TA31 tire. Write your answer as a unit rate.

  4. What do the rates in parts 2 and 3 measure?

  5. If getting the most for your money and staying within your budget is your goal, which tire seems like a better buy? Explain your reasoning. (Hint: Compare the percentage change between the two prices and between the two rates of miles per dollar.)


Section 4.4 Project

LITERS, GALLONS, AND FUEL EFFICIENCY

According to a 2019 report produced by the United Nations, fossil fuel emissions from energy use grew 2.0 % in 2018. These emissions reached a record high of 37.5 gigatons of equivalent C O 2 per year. In order to try to alleviate the issue, many countries are working on requiring that cars become more fuel efficient.

In this activity, you will investigate a few different units used to measure fuel efficiency and how to compare such units.

In the US, we define fuel efficiency as the number of miles a car can travel using one gallon of fuel. The unit of choice for this measurement is miles per gallon (mpg). This number is the rate of miles traveled per gallons used. European countries commonly define fuel efficiency as the amount of fuel a car requires to travel a fixed distance. The unit of choice for this measurement is liters per 100 kilometers L 100 km . This number is the rate of liters of fuel used per 100 kilometers traveled. Notice that mpg is a rate of distance per volume of fuel while L 100 km is a rate of volume of fuel per distance.

The 2021 Honda Accord has a reported highway fuel efficiency of 38 mpg . Complete the following steps to find the Accord's equivalent highway fuel efficiency in the European standard of L 100 km .

Recall that 1 US gallon is equal to 3.785 liters and that 1 mile is approximately equal to 1.61 kilometers.

  1. Determine how many 100 kilometers are in 38 miles. Round your answer to the nearest hundredth, if necessary. (Hint: Find the number of kilometers in 38 miles and divide your answer by 100 .)

  2. Organize this information using the table below.

    Distance Miles 38
    100 Kilometers
    Fuel Volume Gallons 1
    Liters
  3. Now, divide the number of liters per number of 100 kilometers to find the Accord's equivalent European standard fuel efficiency. Round your answer to the nearest hundredth, if necessary.

  4. You may have noticed that the two rates reflect the fuel efficiency of a vehicle, but they are not really measuring the same quantity. As more governments require higher mpg from cars, would the corresponding L 100 km also increase as the mpg increase? Why or why not?


Section 4.5 Project

WHY ARE CELLS SO SMALL?

The germ theory of disease is the fundamental theory of medicine that says infectious diseases are caused by microscopic organisms called pathogens. The theory wasn't accepted until the end of the 19th century, in part because pathogens are invisible to the naked eye.

A main type of pathogen is bacteria (singular, bacterium). These are one-celled (or unicellular) living organisms present almost everywhere on Earth.

In this project, we will explore one possible reason that bacteria are so small.

In order to simplify matters, let's assume we are going to study a bacterium that is perfectly spherical.

Biologists believe that the ability of a bacterium to obtain resources (such as food) is proportional to its radius. They also believe that the bacterium's need (or demand) for resources is proportional to the square of its radius. If the demand for resources is less than or equal to the ability to obtain resources, then the bacterium is able to sustain itself.

The table below contains the values for the ability to obtain resources (A) and the demand for resources (D) for a hypothetical bacterium. Units are omitted for clarity.

Radius (R) Ability (A) Radius Squared (R2) Demand (D)
1.5 0.75 2.25 0.45
2 1 4 0.8
2.5 1.25 6.25 1.25
  1. Assume that A is proportional to R; that is, A = k 1 R for a constant of proportionality k 1 . Determine the value of k 1 .

  2. Assume that D is proportional to R 2 ; that is, D = k 2 R 2 for a constant of proportionality k 2 . Determine the value of k 2 .

  3. When the radius doubles from 1.5 to 3.0 , how many times does the ability to obtain resources increase by?

  4. Determine the demand (D) from a radius of r = 3 . How many times larger is that than the demand (D) when the radius is equal to 1.5 ?

  5. How can these numbers help explain why most unicellular organisms are usually small?


Section 5.1 Project

MAKING ELECTRIC DECISIONS

A door-to-door salesperson cold calls at your house (that is, shows up at your house without prior contact) and tells you about the great deal you can get if you switch your electric provider to a clean, renewable electric supplier they represent. You don't have a current electric bill readily available, so you take down information to compare later. The salesperson tells you that the electric supplier uses 35 % renewable energy and that you will be charged an introductory fixed rate of $ 0.0639 per kilowatt-hour (kWh) with a base-service fee of $ 73 per month, which includes distribution and fees.

  1. Use the information provided by the salesperson to create a function to represent the monthly cost of electric service through the supplier, where x represents the kilowatt-hours used per month.

    You find a copy of your electric bill and discover that you currently pay a fixed rate of $ 0.0724 per kilowatt-hour and a base-service fee of $ 65 per month. You also notice that your current supplier uses 15 % renewable energy.

  2. Use this information to create a function to represent the monthly cost of electric service through your current supplier, where x represents the kilowatt-hours used per month.

  3. Your electric usage for the past 6 months are shown in the second column of the following table. In the third column, use the function from part 1 to calculate the monthly cost of service with the new electric supplier. In the fourth column, use the function from part 2 to calculate the monthly cost of service with the supplier you are currently using. Round your answers to the nearest cent.

    Electric Service Cost Comparison
    Month Electric Usage (in kWh ) New Supplier Cost (in $ ) Current Supplier Cost (in $ )
    December 542
    January 952
    February 638
    March 626
    April 587
    May 597
  4. Based on these calculations, would you spend less money on electric service by switching to the new supplier or keeping your current supplier?

  5. The information from the functions and the table might not provide you with all the information you need to make a decision. Describe two additional types of information you should consider before making a decision and how that information would be useful.

  6. Based on the current information and any addition situations you've considered, would you switch to the new electric provider or stay with your current one?


Section 5.2 Project

THE THEORY OF THE STORK

It has been humorously stated that there are two theories concerning the origin of children: the Theory of Sexual Reproduction (ThoSR) and the Theory of the Stork (ThoS)1. Noticeably absent is the Theory of the Cabbage Patch, which, for whatever reason, has yet to gain traction. With respect to ThoS, it was observed that in the German state of Lower Saxony, between 1970 and 1985, the number of out-of-hospital births decreased while there was also a decline in recorded pairs of storks. Between 1985 and 1995, both of those numbers remained relatively unchanged. Meanwhile, in Brandenburg, the countryside around Berlin, the stork population showed a decline between 1990 and 1991, followed by a general increasing trend from 1991 to 1999. In the city of Berlin, out-of-hospital births showed the same trend. Below is a table with these numbers recorded, rounded to the nearest 10 .

Year Pairs of Storks (x) Out-of-Hospital Births (y)
1990 970 900
1991 850 790
1992 980 780
1993 1210 890
1994 1280 960
1995 1270 1080
1996 1360 1070
1997 1120 1250
1998 1320 1130
1999 1370 1200
  1. Plot the points on a graph with pairs of storks as the x-coordinate and out-of-hospital births as the y-coordinate.

  2. Find the slope-intercept form of the equation for the line passing through the data points representing the lowest number of pairs of storks and the highest number of pairs of storks.

  3. Find the slope-intercept form of the equation for the line passing through the data points representing the lowest number of out-of-hospital births and the highest number of out-of-hospital births.

  4. Find a third slope-intercept form of a line passing through two data points of your own choosing that you think may yield a line that better "fits" the plotted points.

  5. Using the equations for the lines you obtained in parts 2, 3, and 4, choose any x-value from the table and calculate the corresponding y-values. How does each y-value compare to the actual observed number of out-of-hospital births for that number of pairs of storks?

  6. Sketch the three lines on the graph with the plotted data points. Which of the three lines would you consider the "best fit"?

1    Thomas Höfer, Hildegard Przyrembel, and Silvia Verleger, "New Evidence for the Theory of the Stork," Paediatric and Perinatal Epidemiology, Volume 18 (January 2004): 88–92.


Section 5.3 Project

THE NBA AND SHOT DISTRIBUTION

In this project, you will use systems of linear equations and basketball statistics to take a partial set of information to find additional specific details.

During the 2020–21 season2, the teams in the National Basketball Association (NBA) averaged taking 88.4 shots per game (the 3 -point shots attempted plus the 2 -point shots attempted). The teams scored an average of 112.1 points per game with 17 of those points coming from free throws. The average shooting percentages were 36.7 % for 3 -point shots and 53 % for 2 -point shots.

  1. Letting x be the average number of 3 -point attempts per game, write an expression to describe the total points made from 3 -point shots.

  2. Letting y be the average number of 2 -point attempts per game, write an expression to describe the total points made from 2 -point shots.

  3. Use the expressions from parts 1 and 2 to set up a system of linear equations: one equation to describe the number of shots taken and one equation to describe the average number of points scored. (Note: Free throws should not be included in the total number of points since we are only considering 3 -point shots and 2 -point shots.)

  4. Solve the system of equations from part 3 to find the average number of 3 -point shots attempted and the average number of 2 -point shots attempted.

The highest scoring team in the league during the 2020–21 season averaged making 44.7 shots per game and scoring 120.1 points per game with 16.2 of those points coming from free throws. This team averaged taking 37.1 3 -point shots and 54.7 2 -point shots.

  1. Letting a be the percentage of 3 -point attempts made per game (as a decimal), write an expression to describe the total number of points scored from 3 -point shots.

  2. Letting b be the percentage of 2 -point attempts made per game (as a decimal), write an expression to describe the total number of points scored from 2 -point shots.

  3. Use the expressions from parts 5 and 6 to set up a system of linear equations: one equation for the total number of shots made and one equation for the total number of points scored. (Again, note that free throws should not be included in the total number of points since we are only considering 3 -point and 2 -point shots.)

  4. Solve the system of equations from part 7 to find the percent of 3 -point shots made per game and the percent of 2 -point shots made per game.


Section 5.5 Project

MAXIMIZING PROFITS ON JEWELRY SALES

Eve likes to create jewelry as a hobby and has decided to open an Etsy shop to sell some of her creations in hopes of making some extra money. On average, it costs Eve $ 9 to make a necklace and $ 6 to make a pair of earrings. She wants to earn a profit (before taxes and fees) of $ 11 on each necklace sold and $ 8 on each pair of earrings sold. Eve has a starting budget of $ 180 and doesn't want to open her Etsy shop with more than 15 of either type of jewelry. Eve's goal with the Etsy shop is to maximize her potential profit. In this project, you will help Eve determine how many necklaces and how many pairs of earrings she should create to set up her Etsy shop.

Let x represent the number of necklaces and y represent the number of pairs of earrings.

  1. What is the objective function for this situation? Explain what the function represents.

  2. Describe the constraints of the situation and write a linear inequality to represent each one.

  3. Graph the constraints from part 2.

  4. What are the vertices of the feasible region?

  5. Find the maximum of the objective function. Explain what this result means. Does the value make sense? Explain why or why not.

  6. Suppose Eve decided to not limit herself to 15 of each type of jewelry. Would this change the initial setup of her Etsy shop? Explain why or why not.


Section 5.6 Project

THE WEIGHTLESSNESS OF PARABOLIC ARCS

A reduced-gravity aircraft is an aircraft that can simulate weightlessness of its passengers and contents by following a parabolic flight path. While zero gravity (zero-g) is not perfectly attained, the simulation is close enough to zero-g to train astronauts and film movie scenes. This type of aircraft has lovingly been given the nickname "vomit comet" due to two-thirds of all passengers experiencing airsickness during the 40 to 60 parabolic maneuvers of the flight.

According to NASA, the function f t = 4.9 t 2 + 87.21 t + 9144 can be used to describe the altitude in meters of a certain reduced-gravity aircraft t seconds after the start of the parabolic maneuver. Reduced gravity occurs during the entire parabolic arc of the maneuver.

  1. Determine the altitude when reduced gravity starts and ends.

  2. How long does the reduced-gravity period last? Round your answer to the nearest tenth of a second.

  3. What is the maximum height attained by the aircraft during the parabolic maneuver? At what time into the parabolic maneuver is this height attained? Round your answer to the nearest tenth.

Suppose an 80 -second movie scene takes place in zero-g. The production crew needs to plan the film sequence to minimize the cost of renting a reduced-gravity aircraft.

  1. The 80 -second scene would need to be split up across multiple periods of weightlessness and then stitched together in editing. What is the minimum number of parabolic arcs the movie crew would need to film the entire scene once?

  2. If it takes the aircraft approximately 5 minutes from the end of one parabolic arc to set up to start another parabolic arc, how long would it take to film the 80 -second scene one time?

The production crew learns that another company with a reduced-gravity aircraft can follow a parabolic arc of f t = 4.9 t 2 + 98.2 t + 8930 to increase the time spent in weightlessness. The cost is 15 % more than the initial company.

  1. Determine the length of each reduced-gravity period in seconds with the second company. Round your answer to the nearest tenth.

  2. Assuming the aircraft needs the same 5 minutes from the end of a parabolic arc before starting another, determine the total time it would take to film the 80 -second scene. (Hint: Determine the number of arcs needed to film the entire scene.)

  3. Discuss the pros and cons of choosing each reduced-gravity aircraft to film the 80 -second scene.


Section 5.7 Project

USING NEWTON'S LAW OF COOLING TO AVOID COFFEE BURNS

Newton's Law of Cooling gives the temperature of an object (such as a pan or a cup of liquid) as it cools over time to the temperature of its surrounding environment (such as the air in a room). The law can be described with the following function.

T t = T e + T 0 T e e k t

In this function, T t is the temperature of the object at time t, in minutes. The value T e represents the temperature of the surrounding environment, T 0 represents the initial temperature of the object, and k is a constant of variation, which depends on the object.

When brewing coffee, the ideal water temperature is between 195 and 205 degrees Fahrenheit. Suppose some freshly brewed 205 coffee was poured into a ceramic mug with no lid and left in a 73 room. Five minutes after being poured, the coffee is 161.9 . The constant of variation can be calculated as k = 0.079 .

  1. Use the given information to create a function for the temperature of the coffee as it cools over time.

  2. Use the function from part 1 to calculate the temperature of the coffee at the time intervals stated in the following table. Round the temperatures of the coffee to the nearest tenth of a degree.

    Time (minutes) Temperature of
    Coffee ( )
    Time (minutes) Temperature of
    Coffee ( )
    0 5
    1 6
    2 7
    3 8
    4 9
  3. Does the calculated value match the recorded value after 5 minutes? Explain why it does or does not match.

  4. What is the lowest temperature that the coffee can reach in these conditions? Explain your reasoning.

According to the University of Wisconsin–Madison, hot liquids can cause third-degree burns at the following exposure periods and temperatures: 5 seconds at 140 , 2 seconds at 149 , and 1 second at 156 .

  1. After how many minutes is the coffee safe to drink? Explain your reasoning.

  2. A study of 300 participants showed that the preferred drinking temperature of coffee is between 125 and 165 . According to the table in part 2, when does the temperature of the coffee enter this preferred interval?

  3. The same study determined that the optimal drinking temperature is approximately 136 . When is the coffee at that optimal temperature?

  4. If a lid were added to the mug, would that change the cooling rate of the liquid? Explain your reasoning.


Section 6.1 Project

INFLATION AND TIME TRAVEL: THE VALUE OF MONEY OVER TIME

In 1979, the federal minimum wage in the United States was $ 2.90 per hour. By 2019, that number increased to $ 7.25 per hour. While there is a clear increase in the minimum wage in dollars, it is hard to compare the two figures without knowing more about how the economy changed between 1979 and 2019.

In this activity, you will explore different ways to compare the value of money across different time periods.

Economists define inflation as the rise of price levels in the economy over time. The average yearly rate of inflation between 1979 and 2019 was 3.2 % . That means prices of goods and services went up by an average of 3.2 % every year between 1979 and 2019.

  1. Suppose that an item cost $ 1.00 in 1979. What was the price of that item in 2019 when adjusted for inflation? (Hint: You can think about this in terms of an investment that compounds interest—if you invested $ 1.00 in 1979 at 3.2 % compound annually, how much would you have in 2019?)

The answer to part 1 represents the value of $ 1.00 of 1979 currency in 2019 when adjusted by inflation.

  1. What is the 2019 value of the 1979 minimum wage adjusted by inflation? Is this value more or less than the actual 2019 minimum wage?

  2. Purchasing power is considered the amount of goods and services that can be bought with a single unit of money. Is the purchasing power of workers in 2019 lower or greater than the purchasing power of workers in 1979?

  3. Perform an internet search to compare the average yearly tuition at a 4 -year public university between 1979 and 2019. Did tuition increase faster or slower than the inflation rate over the same time period?

During the same time period, the average compensation for company CEOs in the US has increased by 940 % .

  1. Determine the 2019 value of the 1979 minimum wage if it had grown at the same rate as the CEO compensation.

  2. Discuss some ways to adjust the disparity between the highest and lowest paid employees in our economy.


Section 6.2 Project

PAYOUT ANNUITIES: WHAT HAPPENS AFTER YOU RETIRE?

According to Northwestern Mutual, 56 % of adults in the US don't know how much money they will need to save to retire. This can be problematic when setting up your long-term financial goals. In this activity, you will explore a financial instrument, called a payout annuity, that can be used to invest after retirement and maintain a steady income.

In this activity, you will explore different ways to compare the value of money across different time periods.

Suppose you want to have an after-retirement annual income of $ 50,000 for 20 years.

  1. Suppose you plan to place your retirement fund into an account that does not earn interest. How much money would you need in the account by the time you retire?

Without further investing, your retirement fund will sit idle when it could be earning interest. A payout annuity provides regular withdrawals while allowing your balance to earn interest. The following formula is used to calculate the value of a payout annuity that compounds annually and has annual withdrawals.

P = d 1 1 + r N r

Here, P is the starting balance of the account (that is, the size of your retirement fund), d is the regular annual withdrawal, r is the annual interest rate as a decimal, and N is the number of years you plan to take withdrawals.

  1. Suppose that you will invest your retirement fund (the value you found in part 1) for 20 years at an interest rate of 7 % per year. Up to how much could you withdraw yearly in this case and still meet your goal? In other words, what is the value of d in the annuity formula in this case?

  2. Why is the value you found in part 2 larger than $ 50,000 ? Where is the extra money coming from?

  3. Suppose you want to keep your withdrawal at $ 50,000 per year. At the same 7 % interest per year, what starting principal would you need if you want to run out of money in the account after 20 years?

  4. Discuss the reasons you might want to start your retirement with a higher principal than the one found in part 4.


Section 6.3 Project

CAR LOANS: BRAND NEW OR PRE-OWNED?

According to the Brookings Institution, approximately 76 % of working adults in the United States drive to work alone every day. Since owning a car is a big part of our lives, it is important to understand the true cost involved in a car loan. Brand new cars are more expensive but often can be financed at lower interest rates, while pre-owned vehicles cost less but often require a loan at a higher rate. In this activity, you will explore the difference in cost between financing a new vehicle and a pre-owned one.

Consider two options for purchasing a Honda Fit LX in 2020: one was a brand new 2020 model with a manufacturer's suggested retail price (MSRP) of $ 17,945 , and the other was a pre-owned, two-year-old model listed for $ 15,500 . Suppose you have saved $ 1500 for a down payment and the dealer has already included any applicable fees, including taxes, in the advertised price. You plan on taking 5 years to pay off the loan.

The table below shows the price and interest rate for each option.

Price Interest Rate
2020 Honda Fit LX $ 17,945 1.9 %
2018 Honda Fit LX $ 15,000 6.9 %

For both the new and the pre-owned Honda Fit LX options, do the following.

  1. Compute the amount to be financed considering that you have saved $ 1500 for a down payment.

  2. Use the formula for a regular payment on a fixed installment loan to determine the monthly payment. Round your answer to the nearest dollar.

  3. Determine the total amount paid when repaying the car loan.

  4. Determine the finance charge for each purchasing option. This is the difference between the total amount paid on the loan and the amount financed.

  5. Complete the following table.

    2020 Honda Fit LX 2018 Honda Fit LX
    Price $ 17,945 $ 15,000
    Interest Rate 1.9 % 6.9 %
    Down Payment
    Amount Financed
    Monthly Payment
    Total Amount Paid
    Finance Charge
  6. The pre-owned car definitely has a lower monthly payment, which might sound appealing when budgeting your expenses. Could you make an argument, using the values in your table, that the money borrowed to purchase the pre-owned vehicle is actually "more expensive" than the money borrowed to purchase the new vehicle? Explain your reasoning.


Section 6.4 Project

VALUE-ADDED TAXES: AN ALTERNATIVE TO INCOME TAXES

The United States government collects income taxes to pay for a portion of government spending. The highest earners, regardless of their consumption habits, are taxed at higher levels. In contrast, the tax rules in many other countries are designed to tax the consumption of citizens rather than the income of citizens with what is called a value-added tax (VAT). In this taxation model, a certain amount of taxes are collected at each stage of the supply chain, from production to final consumer. The amount of VAT that is paid is calculated on the cost of the product minus any of the costs of materials used in the product that have already been taxed.

Let's assume that a country has a VAT rate of 10 % . We will follow the supply chain for a loaf of bread, from farmer to baker to supermarket.1

  1. The farmer grows the wheat and sells it to the baker for $ 0.30 per unit. The VAT is $ 0.03 ( 10 % of $ 0.30 ) per unit. The baker pays the farmer $ 0.33 for a unit of wheat, and the farmer sends $ 0.03 in VAT to the government.

  2. The baker makes a loaf of bread and sells it to a store for $ 0.60 per loaf. The VAT is $ 0.06 ( 10 % of $ 0.60 ) per loaf. Now the store pays the baker $ 0.66 per loaf, of which $ 0.06 is VAT. Out of $ 0.06 VAT collected from the store, the baker only sends to the government $ 0.03 because he receives a $ 0.03 credit from the government for the VAT paid to the farmer.

  3. The store sells the loaf to a customer for a dollar. The customer pays $ 1.10 . The store sends the government $ 0.04 total—the $ 0.10 it collected in VAT on the sale of the bread minus the $ 0.06 it paid to the baker in VAT, which the store gets back in a credit.

In total, the government received $ 0.03 from the farmer, $ 0.03 from baker, and $ 0.04 from the store. That's $ 0.10 on a final sale of a dollar loaf of bread for a 10 % VAT.

Selling Price VAT Collected VAT Credit VAT Sent to Government
Farmer $ 0.30 $ 0.03 $ 0.00 $ 0.03
Baker $ 0.60 $ 0.06 $ 0.03 $ 0.03
Supermarket $ 1.00 $ 0.10 $ 0.06 $ 0.04
Total $ 0.10

1   Example adapted from "How Does a 'Value Added Tax' Work, Anyway?" Derek Thompson, The Atlantic, March 1, 2010, https://www.theatlantic.com/business/archive/2010/03/how-does-a-value-added-tax-work-anyway/36834/.

  1. Determine the amount of VAT collected, VAT credit, and VAT sent to the government that would be collected at each stage of the supply chain below if the VAT rate were 20 % .

    Selling Price VAT Collected VAT Credit VAT Sent to Government
    Farmer $ 12.00
    Baker $ 24.00
    Supermarket $ 30.00
    Total
  2. Notice that unlike sales, VAT is charged at all stages of the supply chain instead of only on the final consumer. Discuss why this makes it harder for businesses to avoid paying taxes.

  3. VAT rates are usually much higher than sales tax rates; in most of Europe, the VAT rate is around 20 % . Discuss why these higher rates might have an impact on consumption.

  4. Would you be in favor of replacing the US system of income tax with a VAT? Explain your reasoning.


Section 6.5 Project

THE COST OF LIVING IN DIFFERENT PARTS OF THE UNITED STATES

The cost of living can vary considerably across the United States. According to the Missouri Economic Research and Information Center, Mississippi offers the lowest average cost of living while Hawaii tops the list as the most expensive state in the nation. In this activity, you will investigate the cost of living in two metropolitan areas.

The figures in the following table represent a reasonable monthly budget for a family of four with two working adults to attain a modest, yet adequate, standard of living in both the Toledo Metro Area in Ohio and in the Providence Metro area in Rhode Island in 2021.

Expense Toledo, OH Providence, RI
Housing $ 726 $ 1014
Food $ 701 $ 798
Child Care $ 1120 $ 1659
Transportation $ 1164 $ 1112
Health Care $ 895 $ 793
Other Necessities $ 576 $ 731
Taxes $ 643 $ 901
Monthly Total $ 5825 $ 7008
  1. The 2022 minimum wage in Ohio is $ 9.30 per hour. How many hours must each adult in the family work per month at this pay rate to earn the $ 5825 dollars needed to live in Toledo?

  2. Repeat your calculation for Providence, knowing that the 2022 minimum wage is Rhode Island is $ 12.25 and the necessary income is $ 7008 ?

  3. Which city is the one with a true higher cost of living compared to the state's minimum wage.

Now, assume that a regular work week is made of 40 hours and that there are approximately 4.3 weeks in a month.

  1. How much money must each adult earn per hour in Toledo to meet their budget assuming they work regular work weeks during a month? How many times more than the minimum wage in Ohio is the hourly rate you calculated? Assume both adults have equal incomes.

  2. How much money must each adult earn per hour in Providence in order to meet their budget assuming they work regular work weeks during a month? How many times more than the minimum wage in Rhode Island is the hourly rate you calculated? Assume both adults have equal incomes.

  3. Why do you believe there is such a large discrepancy between the minimum wage in each state and the hourly rates you found in parts 4 and 5?


Section 7.2 Project

THE ISLAND OF SIX SYMBOLS

In a remote part of the Ocean of Knowledge lies the Island of Six Symbols. The native inhabitants of the island have a nomadic disposition, and directional words and symbols have come to be an important part of their culture. All forms of written communication and mathematical calculation rely on them. In their writing system, there are only six numerals. There are two versions of these six numerals—one for formal documents and one for normal use.

Formal a silhouette of a fish a silhouette of a lightning bolt a silhouette of an ocean wave a silhouette of a pointing hand a silhouette of a bird a silhouette of a palm tree
Normal
  1. From archeological evidence, we have a partial table of the numeral system. Determine the pattern and fill in the blank cells to complete the table. Does this appear to be a positional system?

    1 7 13 19 25 31 37
    2 8 14 20 26 32 38
    3 9 15 ↓→ 21 27 33 39
    4 10 16 ↓← 22 28 34 40
    5 11 17 23 →↗ 29 35 41
    6 12 18 24 →↖ 30 36 42
  2. Determine the correspondence between these symbols and Hindu-Arabic numerals

    Formal a silhouette of a fish a silhouette of a lightning bolt a silhouette of an ocean wave a silhouette of a pointing hand a silhouette of a bird a silhouette of a palm tree
    Normal
    Hindu-Arabic
  3. Calculate and express the following in both the Six Symbol system and the decimal system. Write the answer using formal numerals.

    1. a silhouette of a palm tree + a silhouette of a bird

    2. a silhouette of a lightning bolt + a silhouette of a lightning bolt

    3. a silhouette of a fish × a silhouette of an ocean wave

    4. a silhouette of a pointing hand × a silhouette of a pointing hand

  4. Does the system have a symbol for zero? If not, create a potential symbol for zero and describe the benefits that can be gained by introducing symbols for zero for both formal and normal use.


Section 7.3 Project

THE BAKER'S DOZEN

In the sixteenth century, bakers in the United Kingdom who sold their goods by the dozen ( 12 items) were obligated to meet specific weight and quality standards. Failing to do so was considered a crime. To avoid punishment, it became a common practice to include an additional item with the dozen purchased to assure the law was properly obeyed. This became known as the baker's dozen.

One particular baker served six customers: Anne, Elinor, Giles, Lancelot, Rose, and Florence. The baker placed their orders on the counter and asked them to verify that their orders were correct and that the orders were, indeed, a baker's dozen each.

Anne nodded her head and confirmed, "Yes. 13 ." The other five nodded as well. Elinor said, " 15 exactly!" Giles smiled, " 23 for me. Perfect." Lancelot added, " 1101 here. Thank you!" Rose happily counted, " 10 for me! Yum!" Finally, Florence, about to sample a morsel, gave a thumbs up and said, " 11 . I love a baker's dozen!"

The baker looked confused. He knew he had put exactly the same number of items in each customer's box. As the pleased clients left the bakery, the solution to the puzzle dawned on him.

  1. Explain the apparent contradiction with the numbers and how each customer arrived at their count. Be sure to support your explanation with useful mathematical expressions and equations.

Later that day, the baker asked his assistant to count the remaining inventory and determine how many items they sold during the day. The assistant counted that there were 22 items left in the inventory. The baker knew they started with 175 items and said, "We've sold 159 items today!" His assistant replied with "No! We sold 243 today."

  1. Explain how both the baker and his assistant are correct.


Section 7.5 Project

THE IMPORTANCE OF DIMENSIONAL ANALYSIS

As part of a vacation, a group of American friends travel to Toronto, ON, in Canada and rent a car so they can also visit surrounding areas. While in Canada, the group experiences firsthand the usefulness of learning to convert from the metric system to the US customary system. Keep in mind that prices in Canada are in given in Canadian dollars (CAD) and not US dollars (USD). Assume the current exchange rate is 1.00 CAD = 0.80 USD .

  1. While renting the car in Toronto, the rental agent tells the group that they can return the car with a full tank of fuel or they can pay 1.999 CAD per liter for the rental company to fill the tank when they return it. Since the current fuel price in the area is 1.279 CAD per liter, the group decides to return the car with a full tank of fuel. The rental car company's policy is to charge the customer for an entire tank of fuel, whether the tank is empty when returned or not. A member of the group looks up the rental car online and learns the fuel tank capacity is 12.5 gallons. How much would the rental company have charged the group to fill the tank with fuel? How much would a full tank of gas have cost the group if they filled it before returning the car?

  2. While at a hotel, the group decides to order a pizza from a local pizza parlor. The menu indicates that a small pizza has a diameter of 25 cm , a medium pizza has a diameter of 33 cm , and a large pizza has a diameter of 41 cm . While at home in the states, the group usually orders two 12 -inch pizzas. Which pizza size should the group order? Is this an exact match in diameter to the size they usually order?

  3. The group plans to drive to Niagara Falls, which is approximately 90 miles from where they are staying in Toronto. The most common speed limit along the route they will take is 100 km hr . Convert 100 km hr to mph (miles per hour).

  4. Estimate how long it will take to drive from where the group is staying to Niagara Falls (include a time buffer of 15 minutes to account for traffic and any areas with a lower speed limit). Round your answer to the nearest quarter of an hour.

  5. The check-in time at their hotel in Niagara Falls is 3:00 p.m. What's the earliest they should leave Toronto if they want to be able to check in upon arrival?

  6. Before heading to the falls, the group stops at a grocery store to pick up snacks. They purchase 1.22 kg of grapes that costs 6.08 CAD kg and 2.39 kg of trail mix that costs 15.67 CAD kg . (Assume these foods are not taxed.) Determine the cost of the grapes and the trail mix in USD oz .

  7. The grocery store allows payment for the purchase when using a credit card in either USD or CAD. If the credit card used to pay for the purchase is based in the US, a conversion fee of 2.8 % is applied if payment is made using CAD. How much would the conversion fee be if the payment is processed in CAD?

  8. While in Niagara Falls, the group reads a sign that says the Horseshoe Falls has a width of 670 meters and a height of 51 meters. The sign also indicates that the flow rate is approximately 2,300,000 liters of water per second. Convert the width and height measurements to feet.

  9. Determine the flow rate in gallons of water per second


Section 8.1 Project

PRIME FACTORIZATION AND THE NUMBER OF FACTORS

In Section 8.1, you learned about prime and composite numbers. In this project, you will explore a way to determine the number of factors a number has by using its prime factorization.

  1. Find the prime factorization of 18 . How many times does each prime factor appear in the prime factorization? Find all possible factors of 18 . How many total factors are there?

  2. Find the prime factorization of 100 , and then find all factors of 100 . How many times does each prime factor appear in the prime factorization? How many total factors are there?

It's possible that in parts 1 and 2 you determined the total number of factors by using a brute-force method to list each factor. Let's explore a systematic way to determine the total number of factors.

  1. Does any factor in the list of factors of 18 have prime factors that are not listed in the prime factorization of 18 ? Similarly, does any factor in the list of factors of 100 have prime factors that are not listed in the prime factorization of 100 ? Explain why it is or isn't possible for the factors to have a prime factor that is not listed in the prime factorization.

Consider the number 72 , which has a prime factorization of 2 2 2 3 3 . We can create the factors of 72 by choosing how many 2 s and 3 s we wish to have in the prime factorization of each individual factor.

  1. Find the factors of 72 that have no 2 s in their prime factorization.

  2. Find the factors of 72 that have exactly one 2 in their prime factorization.

  3. Find the factors of 72 that have exactly two 2 s in their prime factorization.

  4. Find the factors of 72 that have exactly three 2 s in their prime factorization.

If you combine the factors found in parts 4 through 7 into a list, you will have all of the factors of 72 .

  1. How many factors appear in each set of factors in parts 4 through 7? How does this number compare to the number of times 3 appears in the prime factorization of 72 ?

  2. How many sets of factors did we find in parts 4 through 7? How does this compare to the number of times 2 appears in the prime factorization of 72 ?

  3. Use the answers to parts 8 and 9 to create an algebraic expression to describe how the total number of factors of 72 compares to the number of 2 s and number of 3 s in the prime factorization of 72 .

  4. Can you use the same logic to find an algebraic expression to describe how the total number of factors compares to the prime factorizations of 18 and 100 ? If so, write an expression for each.

  5. Find a general rule that gives the number of factors of a given number based on its prime factorization. (Hint: Let p 1 , p 2 , and so on represent the prime factors in the prime factorization.)

  6. Find the number of factors of 900 using the prime factorization. Compare using the formula to the brute-force method of listing every factor.


Section 8.2 Project

AFFINE SHIFT CIPHERS

In Section 8.2, you learned about modular arithmetic. In this project, you will use modular arithmetic to encode and decode messages.

One method of encoding messages is to simply convert the letters of the alphabet to numbers by identifying A with 0 , B with 1 , and so on.

A B C D E F G H I J K L M N O P Q R S T U V W X Y Z
0 1 2 3 4 5 6 7 8 9 10 11 12 13 14 15 16 17 18 19 20 21 22 23 24 25

A message encoded in this manner would be a string of numbers. We can make this encryption slightly more advanced by using a shift cipher, also called a Caesar cipher, which converts the message back to a string of letters. To use a shift cipher on the numerically encoded alphabet, add a fixed value (the "shift" value) to the number and then calculate the result modulo 26 , then substitute the corresponding value into the encoded string.

For example, suppose we want to encode the letter T using a shift cipher with a shift of 9 . First, we need to know that T corresponds to 19 . Adding the shift value results in a value of 28 , which is not a number modulo 26 . We can calculate that 28 mod 26 = 2 . The letter we'd use in the encoded message is C.

  1. Encode the word NOTE using a shift cipher with a shift value of 11 .

If the value of the shift is known, a shift cipher is easy for anyone to decode. In the example with a shift of 9 , the encoded letter was C, which corresponds to a value of 2 . To decode this letter, we subtract the shift value to get 7 . Since this number is negative, we can add 26 to get a value between 0 and 25 . In this case, we get 19 , which corresponds to T.

  1. Decode DLQP that was coded using a shift cipher with a shift of 11 .

Since shift ciphers are relatively easy to decode, more advanced coding methods are used to keep information safe. One slightly more advanced method is an affine shift cipher. This method involves multiplying the letter value by a number relatively prime to 26 , called the key, before adding the shift value. For example, suppose we want to encode the letter T using an affine shift cipher with a key of 7 and a shift of 9 . We would compute 7 19 + 9 = 142 . Next, we would calculate 142 mod 26 = 12 . This means the encoded letter is M.

  1. Encode the word CODE using an affine shift cipher with a key of 5 and a shift of 11 .

To decode a message encoded with a shift cipher, the shift value is subtracted. To decode a message encoded with an affine shift cipher, the shift value is first subtracted and then division modulo 26 is performed. Division in modular arithmetic is a little tricky; it involves multiplying by the multiplicative inverse of the key modulo 26 . For example, if the value of the key is k, we need to find a value d so that k d 1 mod 26 . This is the reason we want k to be relatively prime to 26 : d is the multiplicative inverse of k modulo 26 .

  1. List out the numbers less than 26 that are relatively prime to 26 .

  2. Suppose you intercept a message and discover that it is encoded using an affine shift cipher with a key of 3 and a shift of 12 . Determine the multiplicative inverse of the key modulo 26 . (Hint: Use the list created in part 4 and determine the value of each product modulo 26 .)

  3. You intercept a message that you know has been encoded with an affine shift cipher that has a key of 3 and a shift of 12 . Decode the following message.

    OCO MOOKORMZSY LYIUKLYV

  4. You are told that the following responses to such messages are common.

    • SENDING

    • DECLINE

    • UNCLEAR

    Choose a response to the message and encode it using the same cypher.


Section 8.3 Project

FERMAT AND MERSENNE PRIMES

In Section 8.3, you learned about Fermat's Little Theorem and testing whether numbers are prime. In this project, you will explore two special types of numbers and test whether they are prime.

Very large prime numbers play a vital role in keeping information secure. There are two special types of numbers that have played a role in searching for large primes. They are called Fermat numbers and Mersenne numbers. A Fermat number is a number of the form 2 2 n + 1 , where n = 0 1 2 . For example, when n = 2 , we have the Fermat number 2 2 2 + 1 = 2 4 + 1 = 17 . Since this resulting number is prime, we say that 17 is a Fermat prime.

  1. Find the Fermat numbers that correspond to n = 0 , n = 1 , and n = 3 . Are these numbers Fermat primes? (Note that the Fermat number 65,537 , which corresponds to n = 4 , is a Fermat prime.)

  2. Find the Fermat number that corresponds to n = 5 .
  3. Evaluate the expression 2 9 + 2 7 + 1 2 23 2 21 + 2 19 2 17 + 2 14 2 9 2 7 + 1 . Is the Fermat number that corresponds to n = 5 a prime number? Why or why not?

A Mersenne number is a number of the form 2 p 1 , where p is a prime number. If the result is a prime, then the number is a Mersenne prime.

It is generally unknown which Fermat numbers and which Mersenne numbers are prime. It is believed that only the Fermat numbers corresponding to n = 0 1 2 3 , and 4 are prime and infinitely many Mersenne numbers are prime. In fact, since 1996, the Great Internet Mersenne Prime Search (GIMPS) has been testing larger and larger Mersenne numbers to determine which ones are prime. This collaborative effort uses the computing power of multiple volunteer computers connected to the internet and led to the discovery, in December 2018, of the largest known prime number, 2 82,589,933 1 , which has 24,862,048 digits.

  1. Find the Mersenne numbers that correspond to p = 2 , p = 3 , p = 5 , and p = 7 . Determine whether these are Mersenne primes.

  2. Find the Mersenne number that corresponds to p = 11 .

Recall that the contrapositive of Fermat's Little Theorem is stated as follows:

Let x and n be positive integers. If x n x 0 mod n , then n is not a prime number.

  1. Use the contrapositive of Fermat's Little Theorem to show that the Mersenne number corresponding to p = 11 is not a Mersenne prime. (Hint: Rewrite the exponent as a sum of powers of 2 .)

  2. Find a prime factorization for the Mersenne number in the previous problem. How did you approach factoring it?


Section 9.1 Project

TETRIS-ROBOTICS

Have you ever played the game Tetris? Tetris is a tile-matching video game that was created by Alexey Pajitnov in 1984. The game has seven different pieces, called tetriminos.

A display of seven blocks of different shapes

A display of seven blocks made up of four square in different configurations.

The I block is four squares oriented in a horizontal line.

The J block is three squares in a horizontal line with one square on top of the left-most square.

The L block is three squares in a horizontal line with one square on top of the right-most square.

The O block is four square arranged into a square.

The S block is two rows of two squares with the top row being offset one square to the right from the bottom row.

The L block is three squares in a horizontal line with one square on top of the middle square.

The Z block is two rows of two squares with the top row being offset one square to the left from the bottom row.

Suppose a science club is programming a robot to play a modified game of Tetris. In their game, each square that makes up a tetrimino has a side of 10 inches. For example, the O block, which is 2 squares wide by 2 squares tall, would be 20 inches wide and 20 inches tall while the dimensions of the I block would be 40 inches wide by 10 inches tall. The corresponding playfield is 10 squares wide by 16 squares tall. In this project, you will create a sequence of commands for a robot to navigate a specific path to place a tetrimino in the playfield.

The robot's wheels are 3 inches in diameter, and the robot understands the following commands:

  • Rotate wheels forward n rotations, where n is a positive real number.

  • Rotate wheels backward n rotations, where n is a positive real number.

  • Turn 90 ° left.

  • Turn 90 ° right.

  • A grid of ten squares by sixteen squares. A T block is occupying (4,15), (5,15), this square labeled as R, (6,15), and (5,16). The following squares are also occupied by variuos other blocks: (1,1) through (7,2), (10,1) through (10,4), (1,3), (2,3), (4,3), and (5,3). The empty square (9,2) is labeled as X.

  1. Calculate the distance the robot would travel after one full rotation of its wheels. Then, determine how many rotations are needed to travel the side length of one square. Round your answers to the nearest hundredth.

  2. Determine the total area of the playfield.

  3. Determine the total area of each tetrimino.

  4. During practice sessions, the team had to figure out the basic moves needed to reposition the tetriminos. During one practice session, they worked through the following sequences. In each situation, the robot is centered under the square marked R.

    1. The robot starts as shown, facing toward the right of the playfield. Draw the Z block if the robot turns 90 ° left. Show R with the correct orientation.

      Grid containing a Z block

      Two grids of five squares by five squares. The first grid has a Z block occupying (1,4), (2,4), this square labeled with R, (2,3), and (3,3). The second grid is empty.

    2. The robot starts as shown, facing toward the top of the playfield. Draw the I block if the robot rotates its wheels backwards 1.06 rotations. Show R with the correct orientation.

      Grid containing an I block

      Two grids of five squares by five squares. The first grid has an I block occupying (2,4), this square labeled with R, (3,4), (4,4), and (4,5). The second grid is empty.

    3. The robot starts as shown, facing toward the right of the playfield. Draw the J block if the robot rotates its wheels backwards 2.12 rotations and turns 90 ° right. Show R with the correct orientation.

      Grid containing a J block

      Two grids of five squares by five squares. The first grid has a J block occupying (2,4), (2,3), (3,3), this square labeled with R, and (4,3). The second grid is empty.

    4. Give the directions needed if the robot starts out in the first position and ends in the second position.

      Change in orientation of an L block

      Two grids of five squares by five squares. The first grid, labeled First Position, has an L block occupying (1,4), (2,4), this square labeled with R, (3,4), and (3,5). The second grid, labeled Second Position, has an L block occupying (2,3), (2,2), this square labeled with R, (2,1), and (3,1).

    5. Give the directions needed if the robot starts out in the first position and ends in the second position.

      Change in orientation of an O block

      Two grids of five squares by five squares. The first grid, labeled First Position, has an O block occupying (2,4), this square labeled with R, (3,4), (2,3), and (3,3). The second grid, labeled Second Position, has an O block occupying (2,5), (3,5), (2,4), and (3,4), this square labeled with R.

  5. During a science fair, the first step of the team's demonstration is for the robot to start at the top left corner of the playfield and then travel around the edge of the entire field. How far will the robot travel?

  6. The final demonstration of the robot is to move a T block from the top of the playing field to the bottom so that two full rows are completed. The robot is facing towards the right side of the playfield and centered under the square marked R. What commands should be given to the robot to properly place the block, which would result in the robot being centered in the square marked with an X?


Section 9.2 Project

DESIGNING A SWIMMING POOL

In this project, you will use the knowledge gained in Section 9.2 to design a swimming pool with a concrete walkway and estimate some of the costs involved in installing the pool.

Suppose you are designing a swimming pool for an apartment complex. You are given a few guidelines and a specific location in which to build the pool, but you are able to create the pool however you wish. The overall design phase will consist of designing the pool, estimating costs, and reflecting on your choices.

Design

  1. Determine the shape of the pool. The shape of the pool can be square, circular, or rectangular. If the pool is circular, the depth should be constant. If the pool is square or rectangular, the pool can have a depth that steadily increases from one side to the other to provide a deep end and a shallow end. Create a sketch of the pool.

  2. Consider what a reasonable length, width, and depth would be for the pool. Add measurements to your sketch in feet.

  3. The concrete walkway around the pool needs to be the same width all the way around and wide enough to allow the use of poolside lounge chairs and provide enough room to safely walk. Determine the width you would use for the walkway and add it to your sketch. The depth of the concrete should be 6 inches. (Note: Assume poolside lounge chairs have a length of 6 feet.)

Cost Estimation after the Pool is Installed

  1. Once the pool is constructed, the interior surface will need to be painted with two coats of swimming pool paint. Calculate the surface area of the pool. The paint you will use costs $ 50 per gallon and covers 250 square feet per gallon. How many gallons will you need for the two coats of paint? How much will the paint cost?

  2. Determine the volume of the pool in both cubic feet and gallons using the conversion factor 1 cubic foot 7.48 gallons . (Assume the pool is filled to the top.) To fill the swimming pool with water, it will cost $ 9 for every 1000 gallons of water. How much will the water cost to fill the pool one time, rounded to the nearest dollar?

  3. Calculate the volume of concrete (in cubic feet) the walkway around the pool will require. It will cost $ 4 per cubic foot to have the concrete poured. How much will it cost to pour the concrete?

Analysis

  1. Do any of the costs seem unreasonable? Explain your answer.

  2. What can you change in your plan to decrease the overall cost after the pool is installed?

  3. What are some cost factors that were not considered in this project for the design and installation of the pool?


Section 9.3 Project

MAN CAVES AND SHE SHEDS

The company Tiny House Livings is gearing up for their annual Man Cave and She Shed Competition. Every year the competition focuses on different features; this year's focus is the roof. The main contest restrictions this year are that you cannot measure anything directly with a tape measure, you must use your height and the length of your hand to "measure," and then you must provide the pitch angle and rafter length.

Suppose that you have always dreamed of owning one but haven't had a chance to save up the money to buy one nor the tools and materials to build one. Thanks to the competition, you now have the chance to win one! Use your own hand length as the standard unit of measurement.

A diagram of a house

A diagram of a house with a triangular roof. A leg of the roof is highlighted and labeled "rafter." A line extends down from the peak of the roof, labeled "rise," which creates a right triangle with the rafter. A horizontal line below the house, spanning the base of the right triangle and is labeled "run."

  1. Refer to the sketch provided of a man cave or she shed. First, estimate your height in hands and then estimate that the end of the roof overhang is 4 hands above your head. How high is the end of the roof overhang from the ground?

  2. You use the length of your hand to measure the run of one side of the shed roof, which is half the width of the shed. You discover the run is twenty "hands" long. What is the length of the run in inches?

  3. You estimate the rise to be 8 "hands" high. What is the pitch angle of the roof? Hint: Pay attention to your units!

  4. What is the length of the rafter?

  5. What influences the accuracy of your calculations? What can you do to make the estimations more precise?


Section 10.1 Project

HOW HARD IS BASEBALL COMPARED TO OTHER SPORTS?

Many say that baseball, which is commonly called America's national pastime, is a game with a low success rate. Consider Mookie Betts, one of the greatest players the sport has ever seen. He had a batting average (BA) of .346 during the 2018 season. His batting average was the highest of all players for that year.

A player's batting average is computed by dividing the number of times a player has a hit by the player's total number of at-bats.

BA = Number of Hits Number of At-Bats

Notice that this formula looks a lot like a probability where the sample space is the set of all at-bats and the event is getting a hit.

When fans talk about batting averages, they commonly think of it in terms of probability. That is, if a player is batting .250 , then there is a 25 % chance that they will get a hit at their next at-bat.

  1. Do you agree with the interpretation of the batting average as a probability? Is it possible to compute the theoretical probability that a player will get a hit when at bat? Explain your answer.

  2. Let's return our attention to Mookie Betts. Betts had 520 at-bats during the 2018 season; how many hits did he have that season? Round your answer to the nearest whole number.

  3. Suppose that Mookie Betts had another 20 at-bats during the 2018 season. Assume he had a BA of .500 for those extra 20 at-bats. What would his new 2018 batting average be with these extra 20 at-bats?

During the 2018 season, the entire Major League Baseball batting average was .248 . That is, on average, a player would get a hit 24.8 % percent of the time at bat.

  1. Perform an internet search to find the definition of Field Goal Percentage (FG%) in basketball. Find the National Basketball Association average FG% in the 2018–19 season. Explain this number in terms of players and field goals.

  2. Using this information, decide which sport has a higher success rate. Explain your answer.


Section 10.2 Project

PASSWORDS AND SECURITY: DO HACKERS TEST ALL POSSIBILITIES?

Mark Zuckerberg, the founder and CEO of Facebook, is known to have kept "dadada" as his Twitter and Instagram passwords. Simple passwords of this type are a treat for hackers trying to gain access to an account. These passwords can be guessed in a short amount of time by what is called a dictionary attack. In this case, an intruder tests common words and their combinations until the correct password is found.

What about more secure passwords? Is it possible to simply test all possibilities for a password and gain access to someone's account? In this activity, you will estimate the time it would take to correctly guess a social media account password.

Assume that a social media platform requires your password to have exactly 8 characters selected from any of the 26 letters of the alphabet, the numbers 0 through 9 , and any of the characters #, $, %, or &. In order to simplify our computations, let's assume repetitions are allowed.

  1. Determine the number of distinct passwords that can be created using the requirements described above. The number is very large, so you should use a calculator or computer for your computation.

Now, let's assume that it takes 0.02 seconds to check a single possible password.

  1. How many seconds would it take to check every single possible password? This approach is called a "brute force" attack.

  2. How many seconds are in a year?

  3. How many years would it take to check every single possible password? Round your answer to the nearest whole year.

  4. Explain why it is really a worst-case scenario for the hacker for the brute force attack to take this long.

  5. Do you believe hackers use the brute force attack often? Explain your reasoning.


Section 10.3 Project

THE BIRTHDAY PARADOX

It is often the case that we can gauge how likely an event is by simply thinking of our past experiences and comparing it to other events in our daily lives. For instance, most people would agree that the probability of buying one lottery ticket and winning the jackpot is much lower than the probability of rolling one die and getting a six, which is 1 in 6 . We could use data or computations to confirm our intuition about these situations. In fact, if a lottery was set up where you choose 6 numbers (in any order) from a possible pool of 49 numbers, your chances of winning the jackpot are 1 in 13,983,816 .

Sometimes, however, our intuition betrays us. In this activity, we will investigate a classic probability problem called the birthday paradox.

Consider a room that has 25 people in it.

  1. Do you think that the probability of at least two people sharing a birthday (same month and same day) is above or below 50 % ? Would you say the probability is below 10 % or above 90 % ? Explain your reasoning.

  2. If we assume that there are 365 days in a year, what is the smallest number of people in a room that would guarantee that at least two people in the room share a birthday?

If we have two people in a room, they either share a birthday or they don't. These are complementary events, and we can write the following equation.

P Same Birthday = 1 P Different Birthday

Since there are 365 days in a year, there are 365 364 = 132,860 different ways that the two people can have different birthdays. There are also 365 365 = 133,225 possible pairs of birthdays. From this information, we get the following probability.

P Same Birthday = 1 Different Birthdays All Possible Birthdays = 1 365 364 365 365 0.0027

Hence, with two people in a room, the probability that they share a birthday is 0.27 % .

In a room with three people, we can use the same argument. Either no birthday is shared or at least two people share a birthday. We would have the following probability.

P At Least Two People with the Same Birthday = 1 365 364 363 365 365 365

  1. Complete the computation above. Did the probability increase or decrease by adding just one extra person? By how much?

  2. Now, follow the same reasoning and write an expression for the probability of at least two people sharing a birthday in a room with 25 people.

  3. Use a computer to determine the value of the expression you found in part 4. (Hint: The website wolframalpha.com has a good computation engine.)

  4. How does the answer found in part 5 compare to your answer from part 1?


Section 10.4 Project

THE PROBABILITY OF SPAM FILTERING

According to the website statista.com, 28.5 % of all email traffic in 2019 was made up of spam—those pesky, useless, and potentially dangerous messages that just clog our email inboxes. Most email servers these days can filter spam automatically. Spam messages often have certain suspicious phrases in the subject lines. For example, "You Have Been Selected" is one such phrase.

An incoming email is checked for key elements, such as this phrase, then the server decides whether to put the email in your mailbox or send it to the spam folder.

In this activity, you will estimate the probability that an email with a specific subject line is classified as spam. Let P S be the probability that an email you have received is spam and P S c be the probability that the email is not spam.

  1. According to statista.com, what were the values of P S and P S c in 2019?

Let's assume that 10 % of all spam messages contain the word selected in the subject line. In order to simplify our notation, we will name the events as follows.

S = email is spam

S c = email is not spam

W = subject line contains the word selected

W c = subject line does not contain the word selected

  1. Express the statement " 10 % of all spam messages contain the word selected in the subject line" as a conditional probability.

  2. We also will assume that 0.5 % of all nonspam messages also contain selected in the subject line. Express the previous statement as a conditional probability.

Since every message can be classified as either spam or not spam, the probability that any message has selected in the subject line is the following.

P W = P W S P S + P W S C P S C

  1. Compute the value of P W .

  2. Finally, determine the probability that an email is spam, knowing it has the word selected in the subject line. (Hint: Use Bayes' Theorem.)


Section 10.5 Project

AMERICA'S THIRD FAVORITE PET: CAN WE PREDICT THEIR FUR COLOR?

According to the Humane Society of the United States, rabbits are the third most popular type of mammal owned as pets, with cats and dogs ranking higher. In this activity, you will calculate the probability of seeing a particular fur color when breeding rabbits.

Suppose that a particular breed of rabbit can be one of two colors: gray or white. The color of this breed of rabbit is determined by whether it has at least one dominant allele G in its genotype or whether it has only the recessive allele g. Out of the three possible genotypes (GG, Gg, and gg), rabbits with genotypes GG and Gg exhibit gray fur while rabbits with genotype gg exhibit white fur. Assume that each parent passes on one of its two color alleles to each offspring with equal probability.

If we breed two gray rabbits of genotype Gg, the possibilities for the fur color of the offspring are given in the following table.

Table depicting the fur color of the offspring of two rabbits
The cell is split in half diagonally with a picture of a gray rabbit in each half. One rabbit corresponds to the column headers and the other corresponds to the row headers. G g
G GG and a picture of a gray rabbit Gg and a picture of a gray rabbit
g Gg and a picture of a gray rabbit gg and a picture of a white rabbit
  1. Use the table to determine the probability of a rabbit being gray (GG or Gg alleles) and determine the probability of the rabbit being white (gg alleles) as decimal values.

  2. Construct a table for the breeding of a white rabbit (gg) and a gray rabbit (Gg).

  3. Use your table from part 3 to determine the offspring coloring probability for the breeding of a white rabbit (gg) and a gray rabbit (Gg).

    1. What is the probability that an offspring will be white (gg)?

    2. What is the probability that an offspring will be gray with genotype Gg?

    3. What is the probability that an offspring will be gray with genotype GG?

  1. Use the binomial distribution to determine the probability that a litter of 10 offspring from a white rabbit (gg) and a gray rabbit (Gg) will contain exactly 6 white rabbits.

  2. Use the binomial distribution to determine the probability that a litter of 10 offspring from a white rabbit (gg) and a gray rabbit (Gg) will contain at least 1 gray rabbit.

  3. Without doing any computations, explain what the color of the parents must be to guarantee 100 % of white rabbits as offspring.

  4. Explain what the color of the parents must be to guarantee 100 % of gray rabbits as offspring.


Section 10.6 Project

EXPECTED VALUE AND INSURANCE PREMIUMS

When you purchase a homeowners insurance policy, you pay a certain amount of money (the premium) to the insurance company. If nothing happens to your home, the insurance company keeps the money. If you make a claim, the company will pay to fix your home, usually spending a lot more than what your premium was. Due to this set up, the insurance company makes money on some policies and loses money on others.

In this activity, we will investigate the way an insurance company computes insurance premiums.

Suppose that in a certain neighborhood, an insurance company has used historical data to determine that the probability of a house fire occurring at a home over the course of one year is 0.02 % .

  1. What is the probability that there will not be a fire at a house in the neighborhood over the course of one year?

Assume that the insurance company charges a $ 300 annual premium for fire insurance. If there is a fire, the insurance company will pay out $ 200,000 to the homeowner.

  1. Fill in the table below. What happens when there is no fire? Explain why this is.

    Probability and Payout for Insurance Company
    Event Probability Payout − Premium
    Fire
    No Fire
  2. Determine the expected value that the insurance company will pay out.

  3. What does the expected value say about the average loss or gain for the insurance company on each policy they sell?

  4. How much would the insurance company expect to earn on average if it sold 10,000 policies in a year?


Section 11.1 Project

MODIFYING THE FOCUS OF A STUDY

When presented with the results of a study, it's important to consider the study as a whole before deciding what to do with the information presented. Determining the population and variables of a study will help you understand what was being analyzed. Understanding the results that are presented will help you know whether the type of information used was selected for a reason and whether it might skew the perceived outcome. In this project, you will explore adjusting the study to create more useful results.

  1. A study performed by the Refuel Agency1 determined that college students spent $ 39.6 billion on food in 2020. Identify the population and the variable in this study.

  2. Consider the population and variable from the study found in part 1. Can this information be used to say anything specific about the population at the college you attend? Explain why or why not.

  3. Let's create a more focused population. List three characteristics or restrictions that can be used to define a smaller population that is a subset of the original population. Then, use one or two of these characteristics to create a more specific population description.

  4. Now, let's create a more manageable variable. List three characteristics or restrictions that can be used to more clearly define a narrower variable that is a subset of the original variable. Then, use one or two of these characteristics to create a more specific variable description.

  5. Write a new research question using the population from part 3 and the variable from part 4.

Now that we have a new research question, it's time to decide which sampling method to use. We will assume that the population chosen is too large to get data from every single student in it. (If the population is small enough to get data from every person in it, expand it before continuing to the next steps.)

  1. Create a short survey that could be used to collect the data that you need to answer your research question.

  2. Select one of the sampling methods and explain why you chose it.

  3. Explain why the remaining sampling methods were not chosen.

  4. Identify two possible types of bias that your choice of sampling may have.

1   "Is Your Brand Effectively Marketing to College Undergrads?" Refuel Agency, Last Accessed November 9, 2021, https://www.refuelagency.com/blog/market-to-college-students.


Section 11.2 Project

FOLLOWING THE BOOMERS

The US population is comprised of seven living generations: the Greatest Generation (born 1901–1927), the Silent Generation (1928–1945), Baby Boomers (1946–1964), Generation X (1965–1980), Millennials (1981–1995), Generation Z (1996–2010), and Generation Alpha (2011–2025). In this project, you will construct a series of stacked, side-by-side bar charts that demographers call an age pyramid and focus on how one of these generations affects the pyramid. This pyramid distribution for human population has been observed throughout the history of mankind but, since the 1950s, an interesting trend has developed. Our goal is to identify that trend and offer a reasonable explanation for its occurrence. In the table1 below, we have the distribution of the percentage of the US population by age groups for the years 1950, 1960, 1970, 1980, 1990, 2000, 2010, and 2020. The age groups are further broken down into sex as recorded at birth. The shaded cells roughly represent the portion of the population that was born between 1946 and 1964 (the Baby Boomers), with some overlap into the Silent Generation and Generation X.

Percentage of US Population
Age Group 1950 1960 1970 1980
Male Female Male Female Male Female Male Female
0 9 9.96 9.60 11.01 10.66 9.22 8.86 7.42 7.09
10 19 7.28 7.10 8.53 8.29 9.97 9.63 8.82 8.48
20 29 7.80 8.00 6.08 6.13 7.55 7.54 9.12 9.05
30 39 7.43 7.68 6.67 6.90 5.46 5.63 6.94 7.08
40 49 6.36 6.40 6.15 6.35 5.71 6.06 4.89 5.12
50 59 5.12 5.12 4.93 5.10 4.95 5.37 4.88 5.36
60 69 3.62 3.71 3.52 3.92 3.51 4.15 3.78 4.54
70 79 1.74 1.94 1.98 2.38 1.90 2.65 2.08 3.04
80 + 0.50 0.65 0.57 0.83 0.67 1.16 0.75 1.55
Total % 49.8 50.20 49.44 50.56 48.94 51.05 48.68 51.31
Percentage of US Population
Age Group 1990 2000 2010 2020
Male Female Male Female Male Female Male Female
0 9 7.56 7.21 7.19 6.86 6.70 6.41 6.60 6.31
10 19 7.19 6.82 7.45 7.06 7.06 6.73 6.35 6.06
20 29 8.27 8.01 6.91 6.69 7.02 6.82 6.92 6.57
30 39 8.38 8.44 7.66 7.64 6.48 6.50 6.78 6.63
40 49 6.23 6.42 7.49 7.66 6.97 7.10 6.01 6.09
50 59 4.21 4.53 5.40 5.70 6.64 6.98 6.20 6.44
60 69 3.78 4.49 3.39 3.84 4.54 4.99 5.58 6.13
70 79 2.33 3.33 2.47 3.30 2.41 2.97 3.39 4.02
80 + 0.89 1.91 1.10 2.18 1.32 2.31 1.53 2.40
Total % 48.84 51.16 49.06 50.93 49.10 50.81 49.36 50.65

1   Paul Taylor, "The Next America." Pew Research Center, Washington, D.C. (April 10, 2014) https://www.pewresearch.org/next-america/#Two-Dramas-in-Slow-Motion. Pew Research Center bears no responsibility for the analyses or interpretations of the data presented here. The opinions expressed herein, including any implications for policy, are those of the author and not of Pew Research Center.

  1. For each year that is listed at the top of the table, construct a stacked, side-by-side bar chart by performing the following steps. (If time allows, construct your stacked, side-by-side bar charts on note cards. Be sure the horizontal axis stays the same for each graph. Stack the cards in order and flip through them to create an animated bar chart.)

    1. Center the horizontal axis at 0 % and mark increments of 5 % to the left and to the right.

    2. Beginning at the bottom of the chart with the 0–9 age group, extend a bar to the right of center indicating the appropriate percentage of the population that were female. Extend a bar to the left of center indicating the appropriate percentage of the population that were male.

    3. Continue this process for each age group, stacking the bars on top of one another and shading the Baby Boomer bars a different color than the other bars. It should look similar to the following stacked, side-by-side bar chart. (The following chart is a visual aid only. Notice that the percentages and age groups are different than those given in the table.)

      Demonstration of side-by-side bar chart

      A side-by-side bar chart. The middle of the x-axis is labeled 0% and extends both left and right to 6% by 2%. The left of the center of the chart depicts a bar chart of one data set. The right of the center of the chart depicts a differently colored bar chart of a different data set.

  2. Compare the eight stacked, side-by-side bar charts. How does the shape of the age distribution change over time? What factors might be contributing to this changing shape?

  3. What would you predict the stacked, side-by-side bar charts to look like in 2030, 2040, and 2050?

  4. What additional information is gained by separating the population into sex?


Section 11.3 Project

AVERAGES AND OUTLIERS BETWEEN FRIENDS

Suppose two competitive friends, Student A and Student B, are both finishing up a course on technical writing at different colleges. At the end of the semester, they compare their grades to see who did better in this course. Each friend had to complete a different number of graded assignments and exams, where each grade was given equal weight. The grades earned by the two students on all graded assignments and exams are as follows.

Student A: 78 89 95 64 98 0 87 84 76 93 89 77 61

Student B: 87 79 88 91 89 77 86 93 105 89

In this project, you will use the skills learned in Section 11.3 to determine which friend earned the higher grade in the technical writing course.

  1. For each set of grades, determine the mean, median, mode, range, and standard deviation. Round the answers to the nearest tenth, if necessary.

    Comparison of Students' Grades
    Student A Student B
    Mean
    Median
    Mode
    Range
    Standard Deviation
  2. Compare the grades of the two students. Which value(s) did you use in your comparison? Explain your reasoning.

  3. Determine which value(s) in each student's grades are outliers and remove the outlier(s) from the data sets. Explain why each data point you removed is an outlier.

  4. For each modified data set, determine the mean, median, mode, range, and standard deviation. Round the answers to the nearest tenth, if necessary.

    Comparison of Students' Grades with Outliers Removed
    Student A Student B
    Mean
    Median
    Mode
    Range
    Standard Deviation
  5. Do these new values change your mind of which student performed better in the technical writing course? Explain why or why not.

  6. Do you think outliers should be removed when comparing grades between students? Explain your reasoning.


Section 11.4 Project

IS THAT NORMAL?

In Section 11.4, you learned how to use a normal distribution to calculate z-scores and answer questions about probability. We found that variables such as height, body temperature, weight, and blood pressure are common examples of data that are normally distributed. Because of the relative ease of calculating probabilities using normal distributions, it's tempting to assume, when collecting and analyzing data, that the variable or characteristic in question has a normal distribution. However, if the data set doesn't have a normal distribution, any conclusions we draw using standard scores is suspect at best. Fortunately, there is a method available to check the data beforehand and determine whether the population from which the data are taken has a normal distribution. It is called a normality test.

Normality Test

Step 1:

Sort the data values so they are arranged from smallest to largest, and assign a rank to each value with 1 corresponding to the smallest value and n corresponding to the largest value, where n is equal to the sample size.

Step 2:

Once sorted, compute the percentile occupied by each value using the formula

k 0.5 n ,

where k is the rank.

Step 3:

Using the percentile computed in the previous step, find the corresponding z-score for each value.

Step 4:

Graph the points of the observed values from the data set on the horizontal axis and the corresponding expected z-scores from Step 3 on the vertical axis. This is called a normal probability plot.

Step 5:

If the plot has a linear pattern, we can conclude the data values were drawn from a normal distribution. If the plot shows no pattern or some other trend rather than linear, we can conclude the data are not drawn from a normal distribution.

Note: The data should have no more than one outlier, an extremely large or extremely small value not typical of the other values in the data set. If there are two or more outliers, it is unlikely the data are drawn from a normal distribution.

The Normality Test is straightforward except for Step 3. To find z-scores from percentiles, you are essentially "working backwards" and will need appropriate technology to obtain them. For example, these are the steps when finding the corresponding z-score for the 25th percentile ( 0.25 ) using a TI-83/84 Plus calculator.

Step 1:

Choose DISTR by pressing 2nd then vars.

Step 2:

Select invNorm(.

Step 3:

Press enter.

Step 4:

Input the area to the left of z (that is, the 25th percentile in decimal form), 0.25 .

Step 5:

Press enter five times.

Step 6:

The z-score will be displayed. To two decimal places, it is −0.67 (Note that the negative sign indicates the z-score is in the lower half of the standard normal distribution and lies to the left of the standard mean of zero.)

A calculator screen showing an input of invNorm(0.25,0,1,LEFT) and an output of negative 0.6744897495

If technology is not readily available, the z-scores corresponding to the percentiles in a data set of sample size n = 10 are provided in the following table.

Rank Percentile z-score
1 0.05 1.645
2 0.15 1.036
3 0.25 0.674
4 0.35 0.385
5 0.45 0.126
6 0.55 0.126
7 0.65 0.385
8 0.75 0.674
9 0.85 1.036
10 0.95 1.645

Let's now test a data set to see if we can conclude that the population from which it is taken is normally distributed.

  1. Randomly select 10 classmates and record their heart rate in beats per minute (bpm). You can count the rate for 15 seconds and multiple by four to save time, or you can count for the entire 60 seconds. The counting method is your choice.

  2. Carry out Steps 1 through 4 in the Normality Test. If some heart rates appear more than once, each heart rate will still get its own distinct ranking. For example, if the three lowest rates are all 65 bpm , then followed by 66 bpm , the rankings would be 1 : 65 2 : 65 3 : 65 4 : 66 , and so on. Are there any outliers in your data set? If so, identify them.

  3. Does your graph follow closely enough to a linear pattern for you to conclude the population from which it is drawn is normally distributed? If not, what might be some reasons why? What is the population? What is your conclusion about the distribution of heart rates in the population?

  4. If time permits, repeat the test with another 10 randomly selected classmates and compare results.

  5. If time permits and you have access to technology to calculate the z-score for any given percentile, choose a population of your own that you wish to test for normality and randomly select a sample of arbitrary sample size to conduct your test. Brainstorm with your project team members and instructor to come up with ideas.


Section 11.5 Project

IN THE BLINK OF AN EYE

In Section 11.5, you learned that confidence intervals can be constructed using sample data in order to estimate a population parameter with a certain level of confidence. In this project, you will work with your classmates to collect sample data and construct confidence intervals for the number of times a person blinks in one minute in various circumstances.

Blinking our eyes is something we never think about until, well, we think about it. So let's think about it. Various sources maintain that an individual will, on average, blink somewhere between 15 and 20 times per minute unless they are either engaged in a conversation or focusing intently on a task. When carrying on a conversation, blinks per minute (bpm) tend to increase to between 19 and 26 . The rate of blinking decreases to approximately 4.5 when focusing intently.

The goal of this project is to randomly select ten classmates, record how many times they blink in one minute for each of the three scenarios mentioned above, construct 95 % confidence intervals from the data collected, and see if the reported average blinks per minute for each scenario falls within the interval you construct.

To do so, complete the following steps.

  1. Form a group that consists of at least ten classmates.

  2. For each classmate selected to have their blinks counted, have one group member observe, count, and record the number of blinks, while another group member watches a timer to start and stop the one-minute count. (Multiple experiments should be taking place within the group until the data collection is complete.)

  3. Repeat this process until you have ten data points for each of the following three scenarios.

    1. Have the classmate relax and casually glance around the room, look at their fingernails, flip through a book, etc.

    2. Have the classmate carry on a conversation with another classmate.

    3. Have the classmate focus on something, such as playing a game on a cell phone. Tetris is an excellent choice, but any game will work.

  4. Using the numbers of blinks per minute that your group observed, calculate the sample mean for each of the three scenarios.

  5. Calculate the standard deviation for each sample either by using technology or by applying the following formula, where x ¯ is the sample mean and x i is the ith value in the data set as i ranges from 1 to 10 . Round each value to the nearest ten thousandth.

    s = sample standard deviation = i = 1 10 x i x ¯ 2 9

  6. Using the following formulas, construct a confidence interval for each scenario (relaxed, during conversation, and playing a game). You may use a TI-83/84 Plus calculator or the following formulas. (Note: If you use a calculator, be sure to find the TInterval, not the ZInterval.) Round each endpoint to the nearest hundredth.

    Lower Endpoint:  x ¯ 2.262 s 10

    Upper Endpoint:  x ¯ + 2.262 s 10

  7. Do the reported averages ( 15 20 bpm when relaxed, 19 26 during conversation, and 4.5 while focused) fall within the confidence intervals you found? If not, list some factors that you think may have contributed to the reported average being outside of your confidence interval.

  8. Do you think the experiments used to produce the data for this project are valid ways to measure the numbers of blinks per minute for people at rest, in conversation, and while focusing? Why or why not? In what ways do you think the method of data collection used in these experiments might result in inaccurate estimates of the population parameters?

  9. Draw a general conclusion from your results.


Section 12.2 Project

PIVOTING AN INVENTORY

One aspect of data wrangling is making sure the raw data is cleaned up and organized into a form that can be easily analyzed. This organized data should also be easy to work with to answer the questions being asked about the data. A pivot table is a tool that can quickly summarize a large data set. Pivot tables also have the ability to present several completely different views of the data.

Suppose the inventory manager of a garden center was asked to create a report on the current inventory of blueberry bushes. She wasn't provided a specific question to answer, so she created the following two pivot tables to spark conversation about the current inventory.

Two pivot tables
Age (in Years) Count of Blueberry Size
-Bluecrop 8
1 1
2 2
3 5
-Bluegold 16
1 3
2 6
3 7
-Hardyblue 8
1 4
2 4
-Jersey 5
1 2
2 1
3 2
-Legacy 12
1 8
2 3
3 1
-Patriot 18
1 5
2 6
3 7
Grand Total 67
Harvest Season and Sun Exposure Count of Age (in Years)
-Early 18
-Full Sun 18
Patriot 18
-Late Season 17
-Full Sun 12
Legacy 12
-Full to Partial Sun 5
Jersey 5
-Midseason 32
-Full Sun 8
Bluecrop 8
-Full to Partial Sun 24
Bluegold 16
Hardyblue 8
Grand Total 67
  1. Describe the information presented in the pivot table on the left.

  2. Describe the information presented in the pivot table on the right.

  3. What information is displayed in both tables?

  4. How many different varieties of blueberry bushes does the garden center sell? What varieties do they have?

  5. Which blueberry bush varieties require full sun?

  6. Write a question that the pivot table on the left would answer.

  7. Write a question that the pivot table on the right would answer.

  8. Suppose the inventory manager is given the following question right before the meeting: "What is the age of each blueberry bush in stock and when is the harvest season for each?" Describe how she could create a pivot table to answer this question.


Section 12.3 Project

CORRELATION: STORKS AND BABES

The Theory of the Stork1 states that the number of out-of-hospital births in an area decreases as the number of storks in the area decreases and increases as the number of storks in the area increases. In the project for Section 5.2, you were introduced to a data set collected over a period of ten years consisting of pairs of storks in Brandenburg (the countryside around Berlin) and out-of-hospital births in the city of Berlin. That data set is reproduced below. In this project, we will determine the actual line of best fit for the data and determine whether there is a correlation between the number of pairs of storks and the number of out-of-hospital births in the area.

Year Pairs of Storks (x) Out-of-Hospital Births (y)
1990 970 900
1991 850 790
1992 980 780
1993 1210 890
1994 1280 960
1995 1270 1080
1996 1360 1070
1997 1120 1250
1998 1320 1130
1999 1370 1200
  1. Create a scatter plot using this data set.

  2. Find the equation of the regression line (line of best fit) for the data set and sketch the line on the scatter plot created in part 1.

  3. Calculate the Pearson correlation coefficient for the data set. Then, check for significance at both the 0.05 and 0.01 levels. Is there a statistically significant correlation between stork pairs and out-of-hospital deliveries at both levels of significance?

  4. If there are different conclusions for the different levels of significance in part 3, discuss potential causes and implications of this difference. If the conclusion is the same, did you find it surprising considering the scatter plot?

  5. Use the equation of the regression line found in part 2 to predict the number of out-of-hospital births when during a given year 1100 pairs of storks were observed.

  6. Use the equation of the regression line found in part 2 to predict the number of out-of-hospital births during a given year when 0 pairs of storks are observed.

  7. Are the results obtained in parts 5 and 6 reasonable? Explain why or why not.

1   Thomas Höfer, Hildegard Przyrembel, and Silvia Verleger, "New Evidence for the Theory of the Stork," Paediatric and Perinatal Epidemiology, Volume 18 (January 2004): 88–92.


Section 13.1 Project

WHO WON? IT DEPENDS ON HOW YOU TALLY THE VOTES

In Section 13.1, you learned about five different methods for tallying votes from a preference table and explored how the different methods sometimes lead to different outcomes. Now it's time to start thinking about who might prefer which method in which situation.

As a recap, here are the methods to tally votes from a preference table.

  • The majority rule decision means that the winner is supported by a majority of the voters; that is, more than 50 % of the voters rank a single candidate in first place.

  • The plurality method states that the candidate with the most first-place votes wins—majority or not.

  • The Borda count method assigns each ranking a specific number of points based on how many candidates are in the election.

  • The plurality with elimination method requires the winner to have a majority of the votes and uses a series of eliminations, if necessary, to choose the winner.

  • The pairwise comparison method pairs each candidate with every other candidate in a head-to-head vote count.

Let's compare two of the methods by analyzing the pros and cons of each. Here are some reflection questions to guide your responses.

  1. In what situation might a person prefer this method?

  2. Who stands to benefit from this method?

  3. Who is least likely to benefit from this method?

  4. What is a real-world example where this method is used? (This may require some internet research.)

  1. Select any two of the methods for tallying votes from a preference table.

    Method 1:      

    Method 2:      

  2. Describe an advantage of your chosen Method 1.

  3. Describe a downside of your chosen Method 1.

  4. Describe an advantage of your chosen Method 2.

  5. Describe a downside of your chosen Method 2.

  6. Give an example where a person would prefer one of your chosen methods over the other. State clearly which method is preferred from that person's perspective and why.


Section 13.2 Project

WHAT'S FAIR? DEPENDS ON WHO YOU ASK

In Section 13.2, we discussed five different conditions for determining the fairness of an election. Now it's time to explore how voting procedures and ideas about fairness impact elections in the real world. In this project, we'll consider the fairness of ranked-choice voting, which is equivalent to the plurality with elimination method that is used with preference ballots.

As a recap, here are the fairness criteria.

  • The Condorcet criterion states that if a candidate wins the head-to-head comparison against every other candidate, then that candidate should also win the overall election in a fair voting system.

  • The majority criterion states that if a candidate receives a majority of votes in an election, that candidate should win.

  • The monotonicity criterion states that if a candidate wins an early round of an election and only gains support and does not lose support in subsequent rounds, then that candidate should win the election.

  • The irrelevant alternatives criterion states that if a candidate wins an election, then that same candidate would win the election even if at least one candidate withdraws from the election.

  • The dictator criterion states that no single vote is allowed to decide the outcome of an election.

  1. Find an article online from a reputable source explaining some of the downsides of ranked-choice voting. Record your source and two or three key takeaways from the article.

  2. Find an article online from a reputable source explaining some of the advantages of ranked-choice voting. Record your source and two or three key takeaways from the article.

  3. Find an article online from a reputable source detailing a voting procedure in a state or municipality that uses a vote-tallying method other than majority rule. Record your source and two or three key takeaways describing the method. Reflecting on what you've learned about fairness in voting, state one downside and one advantage of the method described.


Section 13.4 Project

POWER DYNAMICS AT PLAY

In Section 13.4, you learned about weighted voting systems and the power that each player in the system has. In this project, you'll investigate power dynamics. Power dynamics are where weighted voting systems get interesting. Players may have opposing viewpoints that motivate them to desire different outcomes. Each player wants to win and wants to know the likelihood of winning.

Consider a small company with a small number of shareholders who disagree about the direction the company should take. Each member is likely to be acutely aware of how much their vote counts and with whom they need to align to be part of a winning coalition. Let's look at a few power dynamics at play.

  1. Consider a scenario where player 1 is a dictator and is interested in selling some shares to another player, but wants to remain a dictator after the sale. Is this possible in the voting system 20 : 25 5 3 1 ? Explain why this is or isn't possible. If it is possible, how many shares can player 1 sell?

  2. Consider a scenario where player 1 and player 4 rarely vote in the same manner, while player 2 and player 4 often vote the same. In the voting system 14 : 12 7 3 2 , why would player 4 be glad to see player 1 sell two shares to player 2? (Hint: Consider the possible winning coalitions in each voting system.)

  3. Using the same scenario as part 2, use the Banzhaf Power Index to describe in words how player 4's power changes if player 1 sells two shares to player 2.


Section 14.1 Project

THE KÖNIGSBERG BRIDGES

In Section 14.1, you learned about the famous Kӧnigsberg bridge problem that asks whether it is possible to start at one of the land masses in the city and cross every bridge exactly once. Let’s investigate a slight modification of the problem: is it possible to start your journey on one of the land masses, cross every bridge exactly once, and return to the original land mass?

A diagram of the Konigsberg Bridges

Four areas, labeled A, B, C, and D are separated by rivers. Sections A and B are connected by two bridges labeled as a and b. Sections A and C are connected by two bridges labeled as c and d. Sections A and D are connected by one bridge labeled as e. Sections B and D are connected by one bridge labled f. Sections C and D are connected by one bridge labeled as g.

A Simplified Diagram of Kӧnigsberg and Its Bridges
  1. Draw a graph that models the situation. The land masses A, B, C, and D will be represented by vertices while the bridges a, b, c, d, e, f, and g will be represented by edges. Determine the degree of each vertex.

In graph theory, a circuit is a walk that starts and ends at the same vertex.

  1. Find a circuit in the graph that was created in part 1.

We define an Euler circuit as a circuit that uses each edge exactly once. In other words, an Euler circuit starts at a vertex, uses every edge exactly once, and then returns to the same vertex.

  1. Rephrase our version of the Kӧnigsberg bridge problem in terms of Euler circuits.

  2. How many Euler circuits are in the graph?

Notice that in order to produce an Euler circuit, you must enter a vertex using one edge and leave that vertex using a different edge—that is, the edges that meet at a vertex must come in pairs. This indicates that a connected graph will have an Euler circuit when all of its vertices have even degrees.

  1. Use this fact to justify why the modified Kӧnigsberg bridge problem does or does not have a solution.

  2. Draw a graph that represents 4 land masses and 7 bridges that would have an Euler circuit and explain your answer.

  3. Could you remove one of the Kӧnigsberg bridges to create an Euler circuit? If yes, which bridge should be removed? If not, explain why.


Section 14.2 Project

ALGEBRA TREES

In this project, you will explore the use of trees to represent algebraic expressions and other mathematical formulas. Writing expressions in this way can be useful when trying to create a computer program that performs complicated calculations. For example, if we want to represent the expression x + y we could use the following tree.

A tree of x+y

A tree where the top node is +. The left child node is x and the right child node is y.

A slightly more complicated expression, such as 2 x + y , would result in a tree with more levels.

A tree of 2(x+y)

A tree where the top node is . The left child node is 2 and the right child node is + and has two child nodes. The children of the right node, the left child node is x and the right child node is y.

  1. Would the following tree also represent the expression 2 x + y ? Explain why or why not.

    A tree for question 1

    A tree where the top node is +. The left child node is 2 and the right child node is and has two child nodes. The children of the right node, the left child node is x and the right child node is y.

  2. Write an algebraic expression that can be represented by the tree below?

    Hint: Start from the leaves and move your way up.

    A tree for question 2

    A tree where the top node is +. The left node is 7, the middle node is with two children nodes, and the right node is . The children of middle node, the left child node is x and the right child node is x. The children of the right node, the left children node is 2 and the right child node is x.

  3. Explain how the order of operations are related to this type of tree.

  4. The formula to convert a temperature from degrees Fahrenheit to degrees Celsius is given by the equation Using only the operations C = 5 9 F 32 . ⊕, and ⊙ draw a tree to represent the right-hand side of the equation.

  5. Draw a tree for the same formula from part 4 where this time you are allowed to also use the operation of division and all the numbers involved must be integers.


Section 14.3 Project

THE CHROMATIC NUMBER OF BIPARTITE GRAPHS

Recall from Section 14.1 that a vertex coloring of a graph is an assignment of colors to the vertices of that graph such that adjacent vertices have different colors. The chromatic number of a graph is the minimum number of colors needed to produce a vertex coloring. In this activity, you will investigate the chromatic number of bipartite graphs.

Consider the following graph.

A graph with five colored vertices

A graph with five colored vertices. The Green vertex is connected to Red and Yellow. The Yellow vertex is connected to Green, Dark Blue, and Light Blue. The Light Blue vertex is connected to Yellow and Red. The Red vertex is connected to Green, Dark Blue, and Light Blue. The Dark Blue vertex is connected to Red and Yellow.

  1. Is the graph a bipartite graph? If so, does it have a matching? Explain why or why not.

  2. The current vertex coloring uses 5 different colors. Create a vertex coloring using only 4 colors. Explain why this is possible.

  3. Modify your 4 -color vertex coloring to obtain a 3 -color vertex coloring.

  4. Finally, create a 2 -color vertex coloring for the graph. What do you notice about the vertices that have same colors?

Now, consider another graph.

A graph with six unlabeled vertices

A graph with six unlabeled vertices. A starting vertex connects with the second vertex. The second vertex connects with the third and fourth vertices. The third vertex does not have any further connections. The fourth vertex connects with the fifth vertex. The fifth vertex connects with the sixth vertex.

  1. Is the graph bipartite? Explain why or why not.

  2. What is the chromatic number of this graph? (Hint: Start with a 6 -color vertex coloring and remove one color at a time as we did before.) What similarities do you notice between your final vertex coloring and the one you found in part 4?

  3. Is the chromatic number of a bipartite graph always 2 ? Explain why or why not.


Section 14.4 Project

PLANAR POLYHEDRONS

In this section, you learned about planar graphs and how their numbers of v vertices, e edges, and f faces are related by Euler's formula: v + f e = 2 . You may have also learned about vertices, edges, and faces in geometry as part of the study of convex polyhedrons. A convex polyhedron is a solid made up of flat polygonal faces joined at their edges and vertices with the additional property that any line segment joining any two points on the surface of the polyhedron stays on or inside the polyhedron.

A cube is an example of a convex polyhedron.

A diagram of a labeled cube

A cube with one side highlighted and labeled as Face, a line where two sides connect is highlighted and labeled as Edge, and a point where three side connect into a corner is highlighted as Vertex.

  1. How many faces, edges, and vertices does a cube have?

  2. Show that a cube satisfies Euler's formula.

The fact that a cube satisfies Euler's formula isn't a coincidence. We can turn a cube into a planar graph without changing the number of faces, edges, or vertices. The process is illustrated as follows.

A progression of a solid to planar graph

A series of four diagrams.

The first diagram is of a rectangular solid with all the vertices highlighted. The top vertices are highlighted differently and marked by arrows pointing towards the center of the top face of the figure.

The second diagram of a three dimensional figure. The bottom face is rectangular and the top face is a smaller rectangle. The figure tapers upward so that the four side faces are trapezoidal.

The third diagram is the previous diagram with an arrow pointing down towards the top of the figure and labeled Push down.

The fourth diagram is a two dimension figure of a rectangle with highlighted vertices. There is a second rectangle within the first with differently differently highlighted vertices. The corresponding vertices of each rectangle are connected.

  1. Draw the planar graph that corresponds to the tetrahedron, illustrated as follows. (Hint: In this case, all you must do is push down on the top vertex.)

    A three dimensional figure with four triangular faces.
  2. Show that a tetrahedron satisfies Euler's formula.

We can turn any convex polyhedron into a planar graph using a process like the one described for the cube. That is, Euler's formula v + f e = 2 is satisfied for all convex polyhedrons.

  1. One of your classmates claims that they have constructed a convex polyhedron out of two triangles, two squares, six pentagons, and five octagons. Explain why such a convex polyhedron cannot exist. (Hint: Each vertex of a convex polyhedron must border at least three faces, and the sum of the degrees of all the vertices in a graph is equal to twice the number of edges.)