All Chapter Projects


Chapter 1 Project

Patterns, Patterns Everywhere!

An activity to demonstrate the use of mathematical expressions to represent patterns.

Mathematics can be found in nature in the form of patterns. These patterns appear in the symmetry of snowflakes, the grouping of petals on a flower, and even the radial symmetry of a drop of water splashing into a pond. Mathematics can be used to explain and analyze these natural phenomena.

  1. Consider the following pattern.

    The first iteration is 1 dot, the second iteration is 5 dots, and the third iteration is 9 dots

    the first iteration is a single dot centered in the image. The second iteration is 4 new dots surrounding the original 1 dot, one at each of the four corners of a box. This gives a total of 5 dots. The third iteration adds an additional 4 dots to the second iteration's 5 dots. This gives a total of 9 dots. The new 4 dots are placed at each of the corners of a box and now it resembles an x shape.

    1. Describe the pattern in words.

    2. Describe the pattern using a sum of numbers for each iteration.

    3. Fill in the following table using the left side as the iteration of the pattern and the right side to represent how many dots are in that iteration.

      Iteration Number of Dots
      1 1
      2 5
      3 (blank)
      4 (blank)
      5 (blank)
      6 (blank)
      7 (blank)
      8 (blank)
      9 (blank)
      10 (blank)
    4. Create an algebraic expression that represents this pattern using n to represent the number of times the pattern has been drawn.

    5. How many dots would be in the 100th iteration?

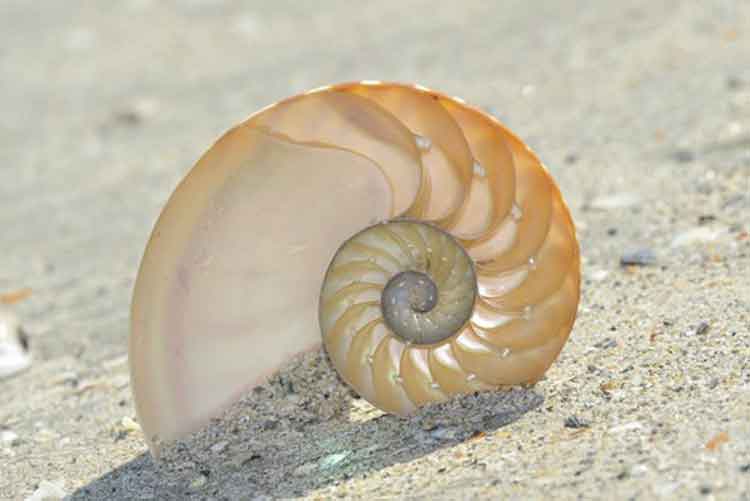
Now we'll look at the pattern formed by the shell of a chambered nautilus, which is a mollusk that lives in the South Pacific Ocean. Due to its distinctive shape, the nautilus shell has been used in art for centuries. The first image shows a cross section of a nautilus shell with a clear view of its chambers. The second image illustrates how the shape of the shell can be approximated by a series of squares that increase in size. This increase in size is a famous pattern often found in nature, the Fibonacci sequence.

Nautilus shell in the shape of a spiral Mathematical diagram of a nautilus shell showing a number pattern

A diagram of how the shape of the nautilus shell can be approximated by a series of squares that increase in size moving in a counterclockwise direction. It starts with the smallest inner spiral as a 1 unit by 1 unit square. Another 1 unit by 1 unit square is added on top of it. To the left is added a 2 unit by 2 unit square. Below that is added a 3 unit by 3 unit square. To the right is added a 5 unit by 5 unit square. Above that is added a 8 unit by 8 unit square. To the left is added 13 unit by 13 unit square that completes the spiral.

  1. Analyze the pattern of the nautilus shell and express the pattern with an algebraic expression. From the pictures of the nautilus shell, you can see a pattern emerge. The inside of the shell starts with a small single square that is one unit per side. Then larger and larger squares are added in a counterclockwise direction using the following number sequence. The side lengths of the squares are described by the pattern 1 1 2 3 5 8 13 21 34 55 89 144 233 377 610

    1. Describe the pattern in words.

    2. Fill in the following table using the left side as the iteration of the pattern and the right to represent the side length of each square.

      Iteration Number of Dots
      1 1
      2 1
      3 (blank)
      4 (blank)
      5 (blank)
      6 (blank)
      7 (blank)
      8 (blank)
      9 (blank)
      10 (blank)
    3. Create an algebraic expression that represents this pattern using n to represent the number of times the pattern has been drawn.

  2. Create your own pattern. Have a classmate describe and create an algebraic expression for the pattern you created.


Chapter 2 Project

A Linear Vacation

An activity to demonstrate the importance of solving linear equations in real life.

The process of finding ways to use math to solve real-life problems is called mathematical modeling. In the following activity you will use linear equations to model real-life scenarios that may arise during a family vacation.

For each question, be sure to write a linear equation in one variable and then solve.

  1. Penny and her family went on vacation to Florida and decided to rent a car to do some sightseeing. The cost of the rental car was a fixed price per day plus $ 0.29 per mile. When she returned the car, the bill was $ 209.80 for three days and they had driven 320 miles. What was the fixed price per day to rent the car?

  2. Penny's son Chase wanted to go to the driving range to hit some golf balls. Penny gave the pro-shop clerk $ 60 for three buckets of golf balls and received $ 7.50 in change. What was the cost of each bucket?

  3. Penny's family decided to go to the Splash Park. They purchased two adult tickets and two child tickets. The adult tickets were 1 1 2 times the price of the child tickets and the total cost for all four tickets was $ 85 . What was the cost of each type of ticket?

  4. Penny's family went shopping at a nearby souvenir shop where they decided to buy matching T-shirts. If they bought four T-shirts and a $ 2.99 bottle of sunscreen for a total cost of $ 54.95 , before tax, how much did each T-shirt cost?

  5. Penny and her family went out to eat at a local restaurant. Three of them ordered a fried shrimp basket, but her daughter Meghan ordered a basket of chicken tenders, which was $ 4.95 less than the shrimp basket. If the total order before tax was $ 46.85 , what was the price of a shrimp basket?

  6. While on the beach, Penny and her family decided to play a game of volleyball. Penny and her son beat her husband and daughter by two points. If the combined score of both teams was 40 , what was the score of the winning team?


Chapter 3 Project

What's Your Car Worth?

An activity to demonstrate the use of linear models in real life.

When buying a new car, there are a number of things to keep in mind: your monthly budget, length of the warranty, routine maintenance costs, potential repair costs, cost of insurance, etc.

One thing you may not have considered is the depreciation, or reduction in value, of the car over time. If you like to purchase a new car every 3 to 5 years, then the retention value of a car, or the portion of the original price remaining, is an important factor to keep in mind. If your new car depreciates in value quickly, you may have to settle for less money if you choose to resell it later or trade it in for a new one.

Below is a table of the original Manufacturer's Suggested Retail Price (MSRP) values and the anticipated retention value after 3 years for three 2017 mid-priced car models.

Car Model 2017 MSRP Expected Value
in 2020
Rate of Depreciation
(slope)
Linear Equation
Mini Cooper $ 21,800 $ 9,590 (blank) (blank)
Toyota Camry $ 23,955 $ 11,211 (blank) (blank)
Ford Taurus $ 28,220 $ 11,234 (blank) (blank)
Graph left intentionally blank

A blank graph titled "Manufacturer's Suggested Retail Price (MSRP)". The horizontal axis is labeled "Years After Purchase" and ranges from 0 to 10 in increments of 1 . The vertical axis is labeled "Car Value (in thousands)" and ranges from 0 to 30 in increments of 5 . The graph is left intentionally blank so that the student can update it as prompted in the following questions.

  1. The x-axis of the graph is labeled "Years after Purchase." Recall that the MSRP value for each car is for the year 2017 when the car was purchased.

    1. What value on the x-axis will correspond to the year 2017?

    2. Using the value from Part a. as the x-coordinate and the MSRP values in column two as the y-coordinates, plot three points on the graph corresponding to the value of the three cars at time of purchase.

    3. What value on the x-axis will correspond to the year 2020?

    4. Using the value from Part c. as the x-coordinate and the expected car values in column three as the y-coordinates, plot three points on the graph corresponding to the value of the three cars in 2020.

  2. Draw a line segment on the graph connecting the pair of points for each car model. Label each line segment after the car model it represents and label each point with a coordinate pair, x y . Consider using a different color when plotting each line segment to help you identify the three models.

  3. Use the slope formula, m = y 2 y 1 x 2 x 1 , to answer the following questions.

    1. Calculate the rate of depreciation for each model by calculating the slope (or rate of change) between each pair of corresponding points using the slope formula and enter it into the appropriate row of column 4 of the table.

    2. Are the slopes calculated above positive or negative? Explain why.

    3. Interpret the meaning of the slope for the Toyota Camry making sure to include the units for the variables.

    4. Which car model depreciates in value the fastest? Explain how you determined this.

  4. Use the slope-intercept form of an equation, y = m x + b , for the following problems.

    1. Write an equation to model the depreciation in value over time of each car (in years). Place these in column five of the table.

    2. What does the y-intercept represent for each car?

  5. Use the equations from problem 4 for the following problems.

    1. Predict the value of the Mini Cooper 4 years after purchase.

    2. Predict the value of the Ford Taurus 2 1 2 years after purchase.

  6. Determine from the graph how long it takes from the time of purchase until the Ford Taurus and the Mini Cooper have the same value. (It may be difficult to read the coordinates for the point of intersection, but you can get a rough idea of the value from the graph. You can find the exact point of intersection by setting the two equations equal to one another and solving for x.)

    1. After how many years are the car values for the Ford Taurus and the Mini Cooper the same? (Round to the nearest tenth.)

    2. What is the approximate value of both cars at this point in time? (Round to the nearest 100 dollars.)

  7. How long will it take for the Toyota Camry to fully depreciate (reach a value of zero)?

    1. For the first method, extend the line segment between the two points plotted for the Toyota Camry until it intersects the horizontal axis. The x-intercept is the time at which the value of the car is zero.

    2. Substitute 0 for y in the equation you developed for the Toyota Camry and solve for x. (Round to the nearest year.)

    3. Compare the results from Parts a. and b. Are the results similar? Why or why not?

  8. How long will it take for the Ford Taurus to fully depreciate? (Repeat Problem 7 for the Ford Taurus. Round to the nearest year.)

  9. Why is there such a difference in depreciation for the Camry and the Taurus? Do some research on a reliable Internet site and list two reasons why cars depreciate at different rates.

  10. Based on what you have learned from this activity, do you think retention value will be a significant factor when you purchase your next car? Why or why not?


Chapter 4 Project

What Do Exponents and Earthquakes Have in Common?

An activity to investigate the Richter magnitude scale for seismic activity.

People living along the San Andreas fault in Southern California are aware that the "big one" is coming. According to scientists, there is a 72 % probability of a 6.7 or larger magnitude earthquake hitting the San Francisco Bay area by the year 2043.1

In this project, you will investigate the meaning of an earthquake's magnitude.

In 1935, Charles Richter proposed a scale to measure the magnitude M of an earthquake according to a formula equivalent to

10 M = I S .

In this formula, I is the intensity of the earthquake in question and S is the intensity of a standard earthquake. For example, if an earthquake has an intensity 10 times that of a standard earthquake ( I = 10 S ), then its Richter magnitude scale is the solution to the equation

10 M = 10 S S .

We can cancel the S in the numerator and denominator and see that that 10 M = 10 , and we get M = 1 .

  1. Use the formula 10 M = I S to complete the following table. Note that the value before S indicates how many times more intense the earthquake is compared to a standard earthquake.

    Earthquake Intensity (I) Richter Magnitude Scale (M)
    S (blank)
    10 S 1
    100 S (blank)
    1000 S (blank)
    10,000 S (blank)
    100,000 S (blank)
  2. By what factor must the intensity of an earthquake increase by in order for the Richter magnitude scale to increase by one point? (This type of scale is called a logarithmic scale and allows very large intensities to be compared by relatively small magnitudes.)

  3. Consider two earthquakes, one of magnitude 6.2 and another of magnitude 4.7 . How many times more intense is the stronger earthquake than the weaker one? (Hint: Would you compare the earthquakes to a standard earthquake or to each other?)

  1. How many times more intense would the "big one" be than the standard earthquake? Recall that the big one has M = 6.7 .

    Similarly, you can measure the intensity of a sound wave relative to that of a standard sound wave. The number B of decibels (dB) for a particular sound is found by solving the equation

    10 B 10 = I S ,

    where I is the intensity of the sound in question and S the intensity of a standard sound.

  2. A jet engine produces 120 dB of sound, which is the threshold for pain and permanent hearing loss, while a quiet room is about 40 dB . How many times more intense is the sound of a jet engine than a quiet room?

1 "The San Andreas Fault: Is the Big One Coming?" How Stuff Works, last modified July 16, 2019, https://science.howstuff-works.com/nature/natural-disasters/san-andreas-fault.


Chapter 5 Project

Gateway to the West

An activity to demonstrate the use of quadratic equations in real life.

The Gateway Arch on the St. Louis riverfront in Missouri serves as an iconic monument symbolizing the westward expansion of American pioneers, such as Lewis and Clark. A nationwide competition was held to choose an architect to design the monument and the winner was Eero Saarinen, a Finnish American who immigrated to the United States with his parents when he was 13 years old. Construction began in 1962 and the monument was completed in 1965. The Gateway Arch is the tallest monument in the United States. It is constructed of stainless steel and weighs more than 43,000 tons. Although the arch is heavy, it was built to sway with the wind to prevent it from being damaged. In a 20 mph wind, the arch can move up to 1 inch. In a 150 mph wind, the arch can move up to 18 inches.

  1. If you were to place the Gateway Arch on a coordinate plane centered around the y-axis, then the equation y = 0.00635 x 2 + 630 could be used to model the height of the arch in feet.

    1. The general form for a quadratic function is y = a x 2 + b x + c . Identify the values for a, b, and c from the Gateway Arch equation.

    2. Find the vertex of the Gateway Arch equation.

    3. Does the vertex represent a maximum or a minimum? Explain your answer based on the coefficients of the Gateway Arch equation.

    4. What is the height of the Gateway Arch at its peak?

    5. Write the equation for the axis of symmetry of the Gateway Arch equation.

    6. Find the x-intercepts of the Gateway Arch equation. Round to the nearest integer.

  2. Using the coordinate plane below and the information from Problem 1, graph the Gateway Arch equation.

    Coordinate plane left intentionally blank

    A blank coordinate plane where the x-axis ranges from 300 to 300 in increments of 100 and the y-axis ranges from 0 to 700 in increments of 100 . The coordinate plane is left intentionally blank so that it can be updated as prompted in Problem 2.

  3. How far apart are the legs of the Gateway Arch at its base?

  4. The Gateway Arch equation is a mathematical model. Look up the actual values for the height of the Gateway Arch and the distance between the legs of the arch at its base on the internet and describe how they compare to the values calculated using the equation.


Chapter 6 Project

Staying within Budget

An activity to demonstrate the use of geometric concepts in real life.

Suppose HGTV came to your home one day and said, "Congratulations, you have just won a FREE makeover for any room in your home! The only catch is that you have to determine the amount of materials needed to do the renovations and keep the budget under $ 2000 ." Could you pass up a deal like that? Would you be able to calculate the amount of flooring and paint needed to remodel the room? Remember it's a FREE makeover if you can!

Let's take an average size room that is rectangular in shape and measures 16 feet 3 inches in width by 18 feet 9 inches in length. The height of the ceiling is 8 feet. The plan is to repaint all the walls and the ceiling and to replace the carpet on the floor with hardwood flooring. You are also going to put crown molding around the top of the walls for a more sophisticated look.

  1. Take the length and width measurements that are in feet and inches and convert them to a fractional number of feet and reduce to lowest terms. (Remember that there are 12 inches in a foot. For example, 12 feet 1 inch 12 1 12 is feet.)

  2. Now convert these same measurements to decimal numbers.

  3. Determine the number of square feet of flooring needed to redo the floor. (Express your answer in terms of a decimal and do not round the number.)

  4. If the flooring comes in boxes that contain 24 square feet, how many boxes of flooring will be needed? (Remember that the store only sells whole boxes of flooring.)

  5. If the flooring you have chosen costs $ 74.50 per box, how much will the hardwood flooring for the room cost (before sales tax)?

  6. Figure out the surface area of the four walls and the ceiling that need to be painted, based on the room's dimensions. (We will ignore any windows, doors, or closets since this is an estimate.)

  7. Assume that a gallon of paint covers 350 square feet and you are going to have to paint the walls and the ceilings twice to cover the current paint color. Determine how many gallons of paint you need to paint the room. (Again, assume that you can only buy whole gallons of paint. Any leftover paint can be used for touch-ups.)

  8. If the paint you have chosen costs $ 18.95 per gallon, calculate the cost of the paint (before sales tax).

  9. Determine how many feet of crown molding will be needed to go around the top of the room.

  10. The molding comes in 12 -foot sections only. How many sections will you need to buy?

  11. If the molding costs $ 2.49 per linear foot, determine the cost of the molding (before sales tax).

  12. Calculate the cost of all the materials for the room makeover (before sales tax).

    1. Were you able to stay within budget for the project?

    2. If so, then what extras could you add? If not, what could you adjust in this renovation to stay within budget?

    3. Using sales tax in your area, calculate the final price of the room makeover with sales tax included.


Chapter 7 Project

Brand New Ride or Gently Used Classic?

An activity to investigate the cost of buying a new car versus a pre-owned vehicle.

According to Wikipedia, there were around 276 million vehicles in the United States in 2018, most of which were passenger vehicles. Since your busy life as a college student certainly forces you to be on the go, owning a car may already be part of your daily life or it may be a plan for the future. Either way, it is important to explore the differences when it comes to financing a brand-new vehicle versus a pre-owned one.

New cars are more expensive and usually come with offers for lower interest rates, while pre-owned vehicles cost less and are often financed at higher rates.

Consider two vehicles. One is a brand new 2019 Honda Civic with a Manufactured Suggested Retail Price (MSRP) of $ 19,550 . The other is a two-year old model of the same vehicle listed online for $ 16,500 . You have saved $ 2000 to use as a down payment and the dealer has already included any applicable fees in the price, such as taxes. You plan on taking 5 years to pay off the loan.

The table below shows the price and interest rate for each option.

Price Interest Rate
2019 Honda Civic $ 19,550 2.5 %
2017 Honda Civic $ 16,500 4.0 %
  1. Taking into consideration the $ 2000 you have saved for the down payment, how much would you finance for the purchase of the 2019 model?

  2. What percentage of the price of the new vehicle is your down payment?

  3. Use the formula for a loan payment to determine the monthly payment on the purchase of the 2019 model.

    PMT = P r n 1 1 + r n n t

  4. Determine the Total Amount Paid when financing the 2019 model. Recall that the total amount paid is the down payment plus the sum of all monthly payments.

  5. Determine the Finance Charge for purchasing the 2019 model.

  6. Repeat 1–5 above for the pre-owned model. That is, find the amount financed, what percentage of price the down payment is, the monthly payment, the total amount paid, and finance charge for the purchase of the 2017 model.

  7. Organize your information on the table below.

    2019 Honda Civic 2017 Honda Civic
    Price $ 19,550 $ 16,500
    Interest Rate 2.5 % 4.0 %
    Down Payment (blank) (blank)
    Amount Financed (blank) (blank)
    Monthly Payment (blank) (blank)
    Total Amount Paid (blank) (blank)
    Finance Charge (blank) (blank)
  8. The pre-owned vehicle has a lower monthly payment, which sounds appealing when budgeting your expenses. Make an argument, using the figures in your table, that the money borrowed to buy a pre-owned vehicle is actually "more expensive" than the money borrowed to purchase the new vehicle.

  9. A simple annuity is a type of investment where an investor makes regular deposits into an account that pays interest over a fixed period of time. The formula for the balance of an annuity is given by

    P = PMT 1 + r n n t 1 r n

    where PMT is the monthly payment amount, t is the number of years, n is the number of payments per year, r is the annual interest rate written as a decimal, and P the balance in the account after t years.

    Suppose that instead of buying a new car now, you decide to invest in an annuity for five years. Every month you will deposit an amount equal to the new car loan payment in an account that earns 3 % per year for five years.

    1. What are the values of n, t, and r in this case?

    2. Use the formula provided to compute the balance P after five years.

    3. Would you rather buy the new car now or save for the next five years? Explain the financial advantages of waiting and the possible personal disadvantages of doing so.


Chapter 8 Project

How Many Workers in Each Department?

An activity to investigate how the use of Venn diagrams can solve a seemingly complicated personnel allocation problem.

According to a job-searching website, "analytical skills are in demand in many industries and are commonly listed requirements in job descriptions. Analytical thinking can help you investigate complex issues, make decisions and develop solutions." 1

One of the main qualities of an analytical thinker is having the ability to translate a real-world problem into a mathematical model, solve the problem, and communicate the answer clearly. In this project you will use your analytical skills to determine how many employees are needed in each department of a company.

As the human resources manager for the small but mighty tech company Boogle, you have the responsibility to determine how many employees are necessary in each of the company's three technical departments: Online Marketing (OM), Information Technology (IT), and Special Projects (SP). Due to the multi-disciplinary nature of the work done at Boogle, the same employee might be required to work in more than one department.

The three-set Venn diagram in Figure 1 shows all the possible departmental intersections at Boogle.

Venn diagram labeled Figure 1

A Venn diagram shows three overlapping circles labeled "IT", "OM", and "SP". The intersection of the three sets (IT, OM, and SP) is labeled "vii". The intersection of IT and SP is labeled "v". The intersection of IT and OM is labeled "vi". The intersection of OM and SP is labeled "iii". In IT alone is the label "iv". In OM alone is the label "ii". In SP alone is the label "i".

  1. Complete the table below with the diagram's region numbers and their respective descriptions.

    Description Region
    Employees who work in SP only i
    (blank) ii
    Employees who work in IT only iv
    Employees who work in SP and IT, but not in OM (blank)
    Employees who work in SP and OM, but not in IT iii
    (blank) vi
    Employees who work in all three departments (blank)

    1 "Analytical Skills: Definitions and Examples" Indeed, accessed September 26, 2019, https://www.indeed.com/career-advice/resumes-cover-letters/analytical-skills.

  2. Now, consider the executive board requirements:

    • The total number of employees in the three technical departments must be exactly 20 .

    • There must be exactly 8 employees in Information Technology and exactly 10 employees in Online Marketing.

    • No employee works in Information Technology and Online Marketing without also being in Special Projects.

    • There must be exactly 4 employees working in both Online Marketing and Special Projects.

    • Exactly 2 employees will be required to work in Special Projects and Online Marketing but not in Information Technology

    Exactly one employee works in Information Technology and Special Projects but not in Online Marketing.

    Use the Venn diagram and these requirements to determine how many employees should be in each department. Clearly state how many employees work in more than one department.

  3. The company decides to add a new technical department named Digital Outreach (DO). This department can only share employees with Online Marketing. Draw a four-set Venn diagram that models this situation.

  4. After adding the Digital Outreach department, the total number of employees increased to 25 . Knowing that 3 people work at DO only, determine how many employees now work in DO and OM at the same time. Did the total number of employees in OM change? Explain your reasoning.


Chapter 9 Project

Sweet, Sweet Probability

An activity to investigate the probability of how often you really get to eat your favorite M&M color.

Probability is integral to the field of statistics. Many companies use probability…make decisions regarding what products they produce and how they produce them. For example, the confectionary division of Mars Inc. uses probability to determine how many M&M's they will make of each color. The color of M&M's candies has changed several times and for varied reasons since the candy was introduced in the 1940s. For example, in 1995, Mars Inc. launched an M&M's Color Campaign, which was a contest that introduced three new colors (purple, blue, and pink) to the public while asking the public to pick one of those colors to replace the tan M&M (blue won).

Mars Inc. used to publish the color distribution on their website but no longer does. Let's investigate the proportions used.

Assume you open a bag of regular M&M's and count the frequency of each color. Your results are shown in the table below.

Color Frequency
Red 10
Orange 8
Yellow 12
Green 9
Blue 3
Brown 6

Use the data from the table above to answer the following questions

  1. What type of probability is being used for this investigation? Explain your answer.

  2. If one M&M is randomly selected, find the probability of selecting a red M&M.

  3. If one M&M is randomly selected, find the probability of selecting a blue M&M.

  4. If one M&M is randomly selected, find the probability of selecting a pink M&M.

  5. If one M&M is randomly selected, find the probability of selecting an M&M that is not brown.

  6. If one M&M is randomly selected, find the probability of selecting an orange or a yellow M&M.

    1. P orange or yellow =

    2. Is this event mutually exclusive? Explain your answer.

  7. If one M&M is randomly selected, find the probability of selecting a red or an orange M&M.

    1. P red or orange =

    2. Is this event mutually exclusive? Explain your answer.

  8. If two M&M's are randomly selected, find the probability of selecting a blue M&M and a green M&M.

    1. With replacement,

      P blue and green =

      Is this event independent or dependent? Explain your answer.

    2. Without replacement,

      P blue and green =

      Is this event independent or dependent? Explain your answer.

  9. If two M&M's are randomly selected, find the probability of selecting two red M&M's.

    1. With replacement,

      P red and red =

      Is this event independent or dependent? Explain your answer.

    2. Without replacement,

      P red and red =

      Is this event independent or dependent? Explain your answer.

  10. Explain why the "with replacement" and "without replacement" probabilities are different


Chapter 10 Project

What's My Average?

An activity to investigate the relationships among different measures of central tendency.

If you are a college student, then grades are important to you. They determine whether or not you are eligible for scholarships or getting into a particular college or program of choice. It is important to be able to calculate your grade point average in a class and to be able to determine the score you need on a test to reach your desired average. Professors have many different ways of calculating your average for a class. Measures of average are often referred to as measures of central tendency. For this project, you will be working with two of these measures, the mean and the median.

Recall that the mean of a set of data is found by adding all the numbers in the set and then dividing by the number of data values. The median is the middle number once you arrange the data in order from smallest to largest. If there is an even number of data values, then the median is the mean of the two middle values. The median separates the data into two parts such that 50 % of the data values are less than the median and 50 % are above the median.

Jonathan and Tristen are two students in Dr. Hawkes Math 230 class. Currently, Dr. Hawkes has given 5 tests and the students' scores are listed below.

Jonathan Tristen
24 80
98 84
86 88
96 72
96 81
  1. Calculate the mean and median of Jonathan's grades.

  2. Calculate the mean and median of Tristen's grades.

  3. Compare the two measures of average for each student.

    1. Are the mean and median similar for Jonathan?

    2. Are the mean and median similar for Tristen?

    3. Based on the mean, who has the best average in the class?

    4. Based on the median, who has the best average in the class?

  4. In your opinion, which student has the most consistent test scores? Explain your reasoning.

  5. If each student had scored 2 points higher on each test, how would this affect

    1. The mean of their grades?

    2. The median?

  6. Dr. Hawkes is planning on giving one more test in the class. His grading scale is as follows. 5. If each student had scored 2 points higher on each test, how would this affect a. The mean of their grades? b. The median?

    A 93 100
    B 85 92
    C 74 84
    D 69 76
    E Below 69
    1. What is the lowest score each student can make on the test and still end up with a grade of C for the class (based on the mean of all test scores)?

    2. Who has to make the higher grade on the last test to get a C, Jonathan or Tristen?

    3. If the last test counts double (equivalent to two test grades) what is the lowest score each student can make on the test in order to make a B in the class (based on the mean of all test scores)? (Do not round the mean.)

    4. If the last test counts double, who has to make the higher grade on the last test to get a B, Jonathan or Tristen?

  7. Based on the work you have done in questions 1 6 , which measure do you think is the best measure of a student's average grade, the mean or the median? (Explain your reasoning by looking at this question from both Jonathan and Tristen's point of view.)