The Performance of the S&P 500 Companies During the Covid-19 Pandemic
An article published by the Wall Street Journal in August of 2021 summarized the effects of Covid-19 on the performance of the S&P 500 companies. More than three-fourths of the companies reported higher revenues than pre-pandemic levels. Of those reporting higher levels of revenue, reported revenues in the second quarter of 2021 above 2019 levels after undergoing a drop in revenues in 2020. Of the remaining companies that had higher revenues, revenues in the second quarter for the past two years exceeded 2019 levels. There were companies in the S&P 500 that had revenues below 2019 levels and ten companies experienced a drop in revenue in 2021 after having a rise in income in 2020.
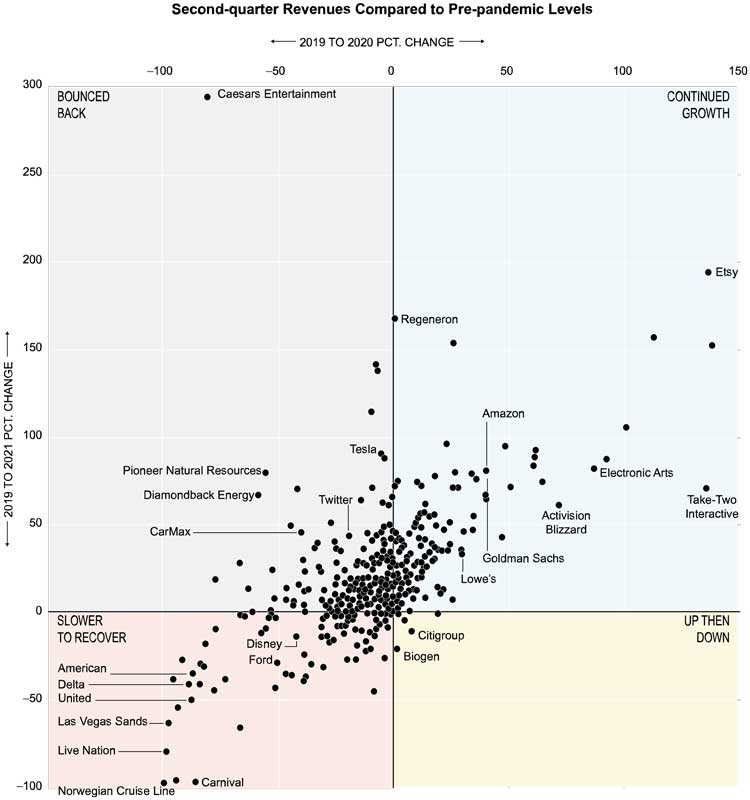
The revenue figures are based on FactSet data for the S&P companies that reported their revenue for the second quarter of 2021. Approximately one-third of the S&P 500 have seen steady or rapid growth throughout the pandemic. The companies that have fared the best are the pharmaceutical, retail, and semiconductor companies. Moderna Inc. experienced the largest increase in revenue of all the S&P companies. Moderna's revenue increased from the second quarter of 2019 to the second quarter of 2021, a value too large to include in the figure below. The consumer services sector experienced the largest decline in second quarter 2021 revenues, largely due to companies related to travel and tourism.

A dot plot, where each dot represents a company, is divided into four quadrants. The vertical axis is labeled "2019 to 2021 PCT. Change" and ranges from to in unit intervals. The horizontal axis is labeled "2019 to 2020 PCT. Change" and ranges from to in unit intervals. The four quadrants are marked with the following labels. The top-right quadrant is labeled "continued growth". In ascending order the titled data points are for the companies Lowe's, Goldman Sachs, Amazon, Activision Blizzard, Electronic Arts, Take-Two Interactive, and Etsy. The company Regeneron is on the axis between the first and second quadrant. The top-left quadrant is labeled "bounced back". In ascending order the titled data points are for the companies are CarMax, Diamondback Energy, Pioneer Natural Resources, Twitter, Tesla, and Caesars Entertainment. Ceasars Entertainment is a clear outlier and at the point of approximately percent change from 2019 to 2020 and at percent change from 2019 to 2021. the bottom-left quadrant is labeled "slower to recover". The titled data points are for the companies are Norwegian Cruise Line, Carnival, American Delta United, Las Vegas Sands, Live Nation, Disney, and Ford. the bottom-right quadrant is labeled "up then down". In ascending order the titled data points are for the companies are Biogen, and Citigroup. Citigroup is the labeled point closest to the origin. Overall the dots increase from left to right across the graph in a linear manner. The majority of the dots are clustered near the origin.
Note: Moderna is excluded. Its second quarter revenue percentage change since 2019 was in 2020 and in 2021.
Source: FactSet
Based on the article summary and the figure, answer the following questions.
-
What is the population of interest?
-
What is/are the variable(s) of interest?
-
Which company experienced the largest percentage change from 2019 to 2021?
-
Based on the figure, which company experienced the largest percentage change from 2019 to 2021? Can you think of an explanation of why this is the case?
-
Based on the figure, which company experienced the smallest percentage change from 2019 to 2021? Can you think of an explanation of why this is the case?
-
Based on the figure, which company did a major recovery from 2020 to 2021 based on revenues? Do some research on the internet to find out what caused the company to make such a major recovery.