All Chapter Projects


Chapter 1 Project

Life Begets Life

Project Goal + Timeline

In this project, we'll explore an important historical experiment that helped develop both the scientific method and our understanding of the nature of living things. This project should be completed by yourself or in a group within one to two hours.

Repeating this historical experiment is possible although not advisable because it involves spoiled food and might take several days! The historical experiment in question will be one of those from Francesco Redi, a 17th century Italian physician and scientist. He was noted for using the scientific method and experiments to debunk or bust contemporary scientific myths or untested beliefs (like a 17th century version of MythBusters!). For example, Redi was the first to demonstrate that a snake's venom is released by its fangs, not from the gallbladder as was widely believed. He also demonstrated that the venom is only dangerous if it is directly injected into the bloodstream (as happens during a bite), not through ingestion.

In his arguably most famous experiment, Redi addressed the question of why spoiled meat develops maggots and flies. At the time of Redi's experiment, the prevailing belief was that flies were spontaneously generated from meat; given enough time, any meat would give rise to flies. Some, such as Redi, argued that flies needed to contact the meat first before the maggots would develop. He hypothesized that flies only come from other flies, not meat.

Directions

Part 1: Redi or Not!

First, imagine yourself (and any study partners) living in the time of Francesco Redi. Consider and answer the following questions:

  1. How would you test the hypothesis that flies only come from other flies?

  2. What might have been the evidence in support of the prevailing belief that meat could spontaneously generate flies? In other words, where might have this idea come from?

  3. What is the significance of the belief of spontaneous generation? Why might it have been important to test Redi's hypothesis?

Now let's analyze the experiment that Redi conducted. To test his hypothesis that flies only come from other flies, Redi placed a piece of meat in 3 jars. The first jar had no lid, the second had no lid but had several layers of gauze covering the top, and the third was sealed with a lid. Flies could contact the meat in the first jar but not the other two. His results are summarized in the following table:

TABLE 1: Treatments in the Redi Experiment
Jar Cover Contact with Flies? Maggots After Several Days
1 none yes present
2 gauze no (only on gauze) absent from meat but present on top of gauze
3 solid lid no absent

Redi made two conclusions based on these results. First, he concluded that the results supported his hypothesis: flies only come from other flies, rather than being spontaneously generated. Second, he concluded that the flies dropped unseen or microscopic eggs on the meat. He deduced this from the second jar, in which flies attempted to lay eggs in the meat but could only deposit them on the gauze.

Compare the experiment you designed to that of Redi, and answer the following questions:

  1. What did you do differently from Redi?

  2. What were the question, hypothesis, prediction, and variables in Redi's experiment?

  3. What controls should have been included, or what changes would you make now to the experiment?

  4. Are the conclusions that Redi inferred reasonable, based on his observations?

  5. What is the importance of the jar with the gauze? Why not just use the open or closed jar? What variable does this control for?

  6. How should Redi communicate these results, if repeated nowadays?

  7. Can you think of another way to address the same underlying question as Redi (spontaneous generation) without using rotting meat?

Part 2: Properties of Living Things

Let's now broaden the discussion to examine what life is, and what components of Redi's experiment consisted of living organisms. What is life?

  1. Think about the characteristics or processes that you would expect to find in any living organism. Then, in Table 2, indicate whether each object or organism exhibits each property given across the top of the table. You may want to add a few additional properties that could help classify things as living or nonliving.

TABLE 2
Object Obtains Energy Uses Energy Grows Reproduces Responds to Stimuli Maintains Homeostasis Other Other
Glass Jar (blank) (blank) (blank) (blank) (blank) (blank) (blank) (blank)
Meat (blank) (blank) (blank) (blank) (blank) (blank) (blank) (blank)
Maggot (blank) (blank) (blank) (blank) (blank) (blank) (blank) (blank)
Fly (blank) (blank) (blank) (blank) (blank) (blank) (blank) (blank)
'Unseen' Fly Eggs (blank) (blank) (blank) (blank) (blank) (blank) (blank) (blank)
Others (blank) (blank) (blank) (blank) (blank) (blank) (blank) (blank)
(blank) (blank) (blank) (blank) (blank) (blank) (blank) (blank)

Let's expand this table to include contemporary everyday objects and organisms. Once again, please add at least a few other examples as you complete Table 3.

TABLE 3
Object Obtains Energy Uses Energy Grows Reproduces Responds to Stimuli Maintains Homeostasis Other Other
Human (blank) (blank) (blank) (blank) (blank) (blank) (blank) (blank)
Solar Panel (blank) (blank) (blank) (blank) (blank) (blank) (blank) (blank)
Horse (blank) (blank) (blank) (blank) (blank) (blank) (blank) (blank)
Mule (blank) (blank) (blank) (blank) (blank) (blank) (blank) (blank)
Mobile (Cell) Phone (blank) (blank) (blank) (blank) (blank) (blank) (blank) (blank)
Flu Virus (blank) (blank) (blank) (blank) (blank) (blank) (blank) (blank)
Bacteria (blank) (blank) (blank) (blank) (blank) (blank) (blank) (blank)
Grass (blank) (blank) (blank) (blank) (blank) (blank) (blank) (blank)
Rock (blank) (blank) (blank) (blank) (blank) (blank) (blank) (blank)
Sugar (blank) (blank) (blank) (blank) (blank) (blank) (blank) (blank)
Language (blank) (blank) (blank) (blank) (blank) (blank) (blank) (blank)
Fire (blank) (blank) (blank) (blank) (blank) (blank) (blank) (blank)
Automobile (blank) (blank) (blank) (blank) (blank) (blank) (blank) (blank)
Computer Virus (blank) (blank) (blank) (blank) (blank) (blank) (blank) (blank)
Android* (blank) (blank) (blank) (blank) (blank) (blank) (blank) (blank)
Replicant** (blank) (blank) (blank) (blank) (blank) (blank) (blank) (blank)
Others (blank) (blank) (blank) (blank) (blank) (blank) (blank) (blank)
(blank) (blank) (blank) (blank) (blank) (blank) (blank) (blank) (blank)

* Here, android refers not to the mobile phone operating system but a humanoid robot traditionally depicted in sci-fi, such as Lt. Commander Data, from Star Trek: The Next Generation.

** Here, replicant refers again not to software but to creations from sci-fi. They are bioengineered humanoid beings created by intent to mimic humans in some ways but with important distinctions.

  1. Based on Tables 2 and 3, which things would you conclude are alive? For each one, summarize your argument. Why did you make that choice?

  2. Apart from the categories listed, what are other things that all the living organisms have in common? How does this relate to the Redi experiment?

  3. What does Table 3 tell you about how living things evolve? What life function or property is most important for evolution by natural selection?

Project Materials

  • 3 tables and corresponding questions

  • 1 pencil or pen

  • Optional: Two jars with at least one lid and several similar pieces of food (meat, fruit, etc.). A third jar and piece of food might be included if a gauze or cloth is available.
Student Checklist


Chapter 2 Project

Chemical Bonds and Beyond!

Project Goal + Timeline

In this project, you will be reviewing your knowledge of chemical bonds by creating three short videos that contrast ionic bonds with covalent bonds and then apply these concepts by explaining carbon's unusual bonding capacity and water's unique properties. This project should be completed either alone or in pairs within a two-hour time frame.

Directions

Create three short explainer videos using the following guidelines.

  • Each video should be between 30 seconds and 1 minute in length. (This is not much time, so get straight to the point and be succinct.) The video may be recorded using a handheld camera (such as a phone camera) or using a video recording program on a laptop, tablet, or other device.

  • For the video's visual aspect, be creative! For example, you can draw visuals on a whiteboard (actual or virtual). Or you can create and/or use 3-D models. If you like, you can use video editing programs.

  • You must include a narration for your video. This narration could be an audio recording or compiled through a text-to-voice program.

  • Begin each video by stating the video number and the video's purpose. (Example: "This is video number 1. I'm going to show you how ionic bonds form by demonstrating with sodium chloride.")

  • After stating the video's purpose, complete the video as described.

Video 1: Ionic Bonds

This video will cover the formation of the ionic bond in sodium chloride (NaCl). Show Bohr models for sodium and chloride. Use Bohr models to explain how these atoms could combine to form NaCl.

After making your video, answer these application questions:

  1. What contribution do protons make to the formation of this bond?

  2. What contribution do electrons make to the formation of this bond?

  3. If the number of neutrons in Na was to increase or decrease by 1, what would happen to the mass of this atom?

Video 2: Covalent Bonds

This video will cover the formation of covalent bonds in water (H2O). First, show Bohr models for hydrogen and oxygen atoms. Then use Bohr models to show how these atoms combine to form a water molecule. Define the term electronegativity. Next, apply the concept of electronegativity to your Bohr model to explain why these particular covalent bonds are considered polar.

After making your video, answer these application questions:

  1. How does the role of electrons in the bonds of a water molecule compare with the role of electrons in the bonds of NaCl?

  2. Water molecules are polar. What does it mean for a molecule to be polar? How does the shape of the water molecule contribute to the molecule's polarity?

  3. List three properties of water that are critical for maintaining life.

  4. For one of these properties stated in Question 3, briefly explain how a water molecule's polarity contributes to it.

Video 3: Bonds in Carbon

This video will cover the bonding capacity of carbon. Depict butane, a simple hydrocarbon, using a line formula (rather than Bohr models). Use symbols for all atoms, not just the carbons. Explain the unique bonding capacity of carbon and use your hydrocarbon model to demonstrate this bonding capacity. Important note: Do not just use the butane as a background image. Use the butane in your explanation by pointing or indicating specifically to places that demonstrate carbon's bonding capacity.

Then, define the term functional group. Choose one functional group from Figure 9 in Lesson 2.3 that would alter some property of this butane molecule. Draw or model one specific way this functional group could functionalize your butane molecule. (Don't just explain it. Show it by replacing a hydrogen atom with this functional group.)

After making your video, answer these application questions:

  1. Identify one new property that this "butane" would have after being functionalized with your chosen functional group.

  2. How could this hydrocarbon form a cyclic hydrocarbon?

Project Materials

  • Camera, such as phone camera or laptop camera (for filming video)

  • Visual aid materials for video, such as a whiteboard (actual or virtual; hawkes.biz/whiteboard)

  • Questions

  • Pen or pencil

  • Optional: video props, such as chemical models

Student Checklist


Chapter 3 Project

A Tale of Four Carbs

Project Goal + Timeline

This three-part project will review your knowledge of biomolecule structure by modeling four carbohydrates using pipe cleaners and beads. Then, as a group or individually, you will consider the limitations of using the same modeling system—pipe cleaners and beads—for modeling other classes of biomolecules. Finally, you will apply what you've learned to complete a dehydration/hydrolysis puzzle.

This project should be completed by yourself or in a group of two within a two-hour time frame.

Directions

Part 1: Build Four Carbohydrate Models

For carbohydrate #1, select ten beads of the same color. String those beads onto a pipe cleaner. Bend the ends to secure the beads. The full-beaded pipe cleaner is your carbohydrate #1. Use your knowledge of biomolecular structure, especially the relationship between monomer and polymer, to answer the following questions about your model.

  1. Of the following list, which object from your model best represents a monomer? Select the correct answer.

    1. the individual beads

    2. the full-beaded length of the pipe cleaner

    3. the pipe cleaner

    4. This model does not have an object representing a monomer.

  2. In assembling your polymer, have you better demonstrated a dehydration reaction or a hydrolysis reaction? Explain your answer.

    Now, suppose instead you wished to demonstrate the other reaction—dehydration or hydrolysis—what action could you take with your model to do so? Be sure to answer using complete sentences.

Next, use a small piece of masking tape to label carbohydrate #1 as "Starch." Knowing now that this carbohydrate #1 represents starch, answer the following questions.

  1. Which of the following best describes starch? Select the correct answer.

    1. Starch is a type of carbohydrate called a polymer.

    2. Starch is a type of nucleic acid called a galactose.

    3. Starch is a type of carbohydrate called a polysaccharide.

    4. Starch is a type of nucleic acid called a polymer.

  2. Which bead color did you choose for building your polymer? Different bead colors will represent different types of monosaccharides. If this molecule is starch, what kind of monosaccharide does this specific bead color now stand for?

  3. Assign this bead color to the correct monosaccharide in Table 1. Then assign the other two bead colors to the remaining monosaccharides.

TABLE 1: Monosaccharides Represented by Bead Color
Monosaccharides Bead Color
glucose (blank)
galactose (blank)
fructose (blank)

For carbohydrate #2, consider a different, albeit similar, kind of carbohydrate—amylopectin. Review the structural differences between starch and amylopectin. Then, using pipe cleaners and beads, build a second model to represent an amylopectin polymer. (Hint: Feel free to use more than one pipe cleaner if necessary. Also, be sure to use the correct bead color.) Use a small piece of masking tape to label your model "Amylopectin."

Then, answer the following questions pertaining to your model.

  1. Describe a shape difference between amylopectin compared to the starch. Explain how you achieved this difference using the materials provided.

  2. Come up with one aspect of this model that remains unchanged.

For carbohydrate #3, start by cutting a pipe cleaner into pieces about 2 inches long. Consider how a disaccharide differs in structure from starch and amylopectin. Review the structural differences between disaccharides and polysaccharides if necessary. Then, use your knowledge to build a single disaccharide model using pipe cleaners and beads. Use a small piece of masking tape to label this model "Disaccharide."

  1. Describe a major structural difference between carbohydrate model #3—the disaccharide—compared to carbohydrates #1 and #2. Explain this difference.

  2. What colors of beads did you use? What monosaccharides do they represent? If you aren't sure, refer to Table 1 where you assigned bead colors to monosaccharides.

For carbohydrate #4, build another disaccharide. This time, start by selecting a specific disaccharide. Then, choose the beads you need. Review examples of disaccharides in your text if necessary. Be sure to choose a disaccharide that you can build from the monosaccharides in Table 1. Write down the name of your chosen disaccharide. Then, assemble your model. Use masking tape to label your model with the correct disaccharide name.

After you complete your carbohydrate model #4, answer the following questions.

  1. Explain your choice of bead color.

  2. How many glycosidic bonds does your model contain?

To complete Part 1, take pictures of your models and paste them into a document. Submit this document along with your answers to the questions.

Part 2: Structure and Modeling of Other Classes of Biomolecules

  1. In your opinion, how well would the pipe cleaner/bead system from Part 1 work to represent protein structure? What kind of monomer would each bead then represent? Would three bead colors be enough? Explain why or why not. To have enough colors to represent all of a protein's monomer-types, how many bead colors would be needed?

  2. In your opinion, how well would the pipe cleaner/bead system work for modeling lipids? What challenges would you run into if you tried to use the beads to represent the monomer units?

  3. In your opinion, how well would the pipe cleaner/bead system work for modeling nucleic acids? What monomer would the beads represent? Are three bead colors sufficient to represent most nucleic acids? Explain your answer.

Part 3: Hydrolysis and Dehydration Reactions

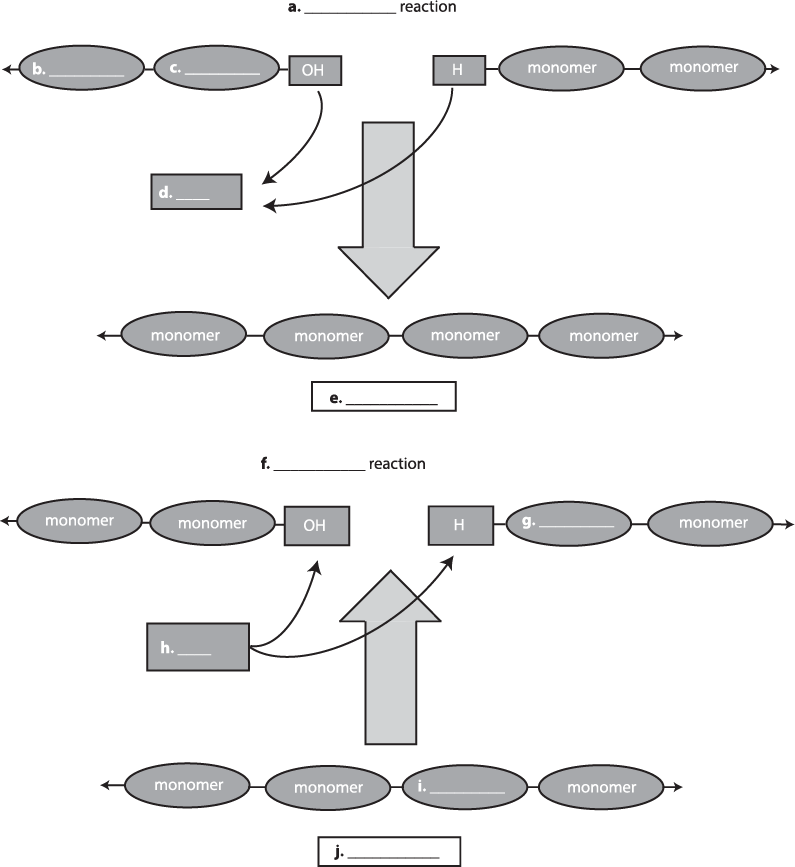
The following diagram shows two types of reactions. Fill in the missing labels for letters a–j. Use terms from the following list: H2O, monomer, polymer, hydrochloric, dehydration, hydrolysis. Terms can be used more than once, and some terms may not be used at all.

  1. A map of monomer chains describing different reactions with blanks for answers

    Answer a. asks to identify the reaction shown from the illustration that includes answers b. through e. It is described as the following: b. and c. are linked to OH. Directly beside this, though not connected, is H linked to two monomers. Arrows point from these two chains to d., which is asking what these two chains represent. A larger arrow points down from these two chains to a chain of four monomers, and e. asks what kind of reaction this represents. Answer f. asks to identify the reactions shown from the illustration that includes answers g. through f. Two chains are shown: one with two monomers and OH and the other with H, answer g., and a monomer. Answer h. has arrows pointing to these two chains, which is asking what these two chains represent. A larger arrow points up toward these two chains from a chain below, which includes three monomers and answer i. Answer j. asks what kind of reaction this represents.

  2. You may have heard this common warning for people training in cold-climate survival, "Even when thirsty, don't eat snow." Of course, snow contains water. So, what's the problem? Some people warn that consuming snow may accelerate dehydration, partly due to the lowering of body temperature and the body's need to elevate metabolism to compensate. Considering what you know about dehydration and hydrolysis reactions, how might an increased metabolism, such as generating extra body heat, result in less free water in the body?

  3. Imagine your friend attempts to explain dehydration/hydrolysis reactions using the following (flawed) demonstration. Your friend uses toothpicks and marshmallows. The marshmallows represent monomers, he explains. The toothpicks represent water molecules. Then, he connects the marshmallows together with toothpicks in a straight line. Your friend claims that this demonstrates dehydration reactions because putting the marshmallows together consumes a toothpick (water molecule), whereas separating the marshmallows (hydrolysis) liberates a water molecule. What is flawed about your friend's demonstration? What could you say to correct his understanding of hydrolysis and dehydration reactions?

To complete Part 3, submit answers to the previous questions.

Project Materials

  • 5 pipe cleaners

  • 60 beads in three colors, 20 of each color

  • Masking tape

  • Scissors

  • Pen or pencil

Student Checklist


Chapter 4 Project

Solving a Cell Mystery

Project Goal + Timeline

In this project, we will review your knowledge of the organelles and structures that make up cells by building a model of a eukaryotic or bacteria cell. The project will conclude with a Guess-That-Cell game, involving the entire class, guessing the identity of each constructed model. The cell model should be constructed individually. The Guess-That-Cell game involves the entire class. The entire project should be completed in 2 sessions. Aim for 90 minutes for model building time and 30 minutes for the Guess-That-Cell game.

Directions

Part 1: Test Your Knowledge

TABLE 1: Pick a cell component that, if malfunctioning, could explain each described problem.
Description of Cell Problem Malfunctioning Organelle/Cell Structure
Protein synthesis is impaired. Evidence suggests the DNA itself is intact. It also appears that mRNA is synthesized correctly and leaves the nucleus. (blank)
Cultured animal cells fail to complete mitosis. DNA condenses properly. The cells fail to carry out cytokinesis and fail to adapt their shape correctly. (blank)
Cell growth and activity is impaired due to low levels of cellular energy. (blank)
Plant cells are fragile and rupture easily when exposed to osmotic pressure. (blank)

Part 2: Select and Create Your Cell Model

Roll a six-sided die. From the following list, circle the cell for the number you rolled: (1 or 2) animal cell, (3 or 4) plant cell, (5 or 6) prokaryotic cell. Then, research this cell type. Answer the following planning questions pertaining to your cell type.

  1. Briefly describe this cell's appearance. Is your cell a eukaryotic or prokaryotic cell?

  2. Compare your cell type to the other two cell type options. Look for differences. How does the shape compare? Do any structures/organelles show up in one but not the other? Identify three structural differences and write them down.

  3. Before constructing your model, do some planning. Sketch your cell in the following table. Which organelles/structures must your model be able to represent? List craft supplies to represent each structure to include. This is an opportunity to get creative and use any materials available to you.

TABLE 2: Plan for how to build your model.
Sketch your cell in the following space. List organelles to include in model. List craft items to represent organelles.
(blank) (blank) (blank)

Now build your cell model! This can be done either in class or as a take-home project. If completed at home, use craft supplies found at home. Here are some guidelines to follow:

  • The model should be about the size of a fist.

  • The model should show the cell's 3-D shape.

  • A cutaway portion should show the internal organelles/structures.

  • All structures/organelles should be labeled. (Toothpick and masking tape flags work well.)

  • Do not stick a cell type label to your model.

Finally, write the cell type on an index card. This card will accompany your model. Then, flip the card over.

Part 3: Play Guess-That-Cell

As a class, set up display tables for all cell models. Number each card to allow for easy identification.

Game Rules: The class explores the displays quietly for 5–10 minutes. Individually, guess each model's cell type as either plant, animal, or bacteria. Write your guesses down. After guessing, discuss your results as a class and uncover the correct answers.

To submit your project, turn in Table 1, Part 2 Questions, and your model.

Project Materials

  • 1 die, 6-sided (or random number generator)

  • Glue

  • Tape

  • Pencil

  • Markers

  • Miscellaneous craft supplies (e.g., paper, paper clips, toothpicks, pipe cleaners, straws, Play-Doh, etc.)

Student Checklist


Chapter 5 Project

A "Beary" Gummy Experiment

Project Goal + Timeline

In this project, you will be reviewing your knowledge of diffusion and osmosis by conducting a 24-hour gummy candy experiment. You'll soak gummy bears in distilled water and in NaCl solutions with different concentrations overnight. You will record the mass of the gummy bears before and after the overnight soak to explore the relationship between a solution's tonicity and the passive transport of water. This project can be completed individually or in a group over 24 hours. The estimated active work time is two hours.

Directions

Part 1: Pre-lab Questions

Answer these questions before you begin your experiment.

  1. Gummy bears will soak overnight in three solutions: (1) distilled water, (2) a 0.25 M NaCl solution, and (3) a 1.0 M NaCl solution. Assume the gummy bears are semipermeable in that they can absorb water but not NaCl. Based on this assumption, how do you expect the size of the bears to change in distilled water and in the 1.0 M NaCl solution? Explain your reasoning by discussing how the net movement of water might differ in these treatments. Would this movement be best described as passive or active transport?

  2. What if the gummy bears are fully permeable to both water and NaCl? How would you expect the size changes of the bears to differ from your prediction for Question 1?

Part 2: The Gummy Bear Osmosis Experiment

Step 1. Use a permanent marker to label the four spoons and the four clear cups: "control," "distilled water," "1.0 M NaCl," and "0.25 M NaCl." Label both the side and the bottom of the cup. (The bottom label allows you to read the label when looking down.)

Step 2. Prepare a 1.0 M NaCl solution by dissolving 14.6 g of NaCl in 250 mL of distilled water. Prepare a 0.25 M NaCl solution by dissolving 3.7 g of NaCl in 250 mL of distilled water. Pour each solution into the appropriately labeled cup. Pour 250 mL of distilled water into the cup labeled "distilled water." The cup labeled "control" will remain empty.

Step 3. Select four gummy bears of the same color. Then, label the individual bears by writing directly on each bear with your fine-tipped permanent marker. (That way, when you remove bears from the solution to mass them, you won't forget which bear goes with which solution.)

Step 4. Now examine Table 1. Fill in the initial date and time for T0 (timepoint 0, the initial time) with the date and time you begin the experiment. Take the mass of each bear. Record each bear's initial mass at the appropriate location in the table.

TABLE 1: Gummy Bear Mass (g) Over Time for Different Solutions
Gummy bear mass (g) versus solution concentration
Solution T0 (initial time)
Date: (blank)
Time: (blank)
T1
Date: (blank)
Time: (blank)
T2
Date: (blank)
Time: (blank)
T3 (final time)
Date: (blank)
Time: (blank)
Net change in mass (g)
1.0 M NaCl (blank) (blank) (blank) (blank) (blank)
0.25 M NaCl (blank) (blank) (blank) (blank) (blank)
distilled water (blank) (blank) (blank) (blank) (blank)
control (blank) (blank) (blank) (blank) (blank)

Step 5. Add each gummy bear to the appropriately labeled cup. Notice that the control bear will not go into a liquid. Instead, it goes in the empty cup labeled "control."

Step 6. Begin completing Table 2 by writing brief descriptions of the initial appearance of each bear in its cup. Optional: Take a top-down picture of each cup for later reference.

TABLE 2: Gummy Bear Appearance Over Time for Different Solutions
Gummy bear appearance versus solution concentration
Solution T0 (initial time)
Date: (blank)
Time: (blank)
T1
Date: (blank)
Time: (blank)
T2
Date: (blank)
Time: (blank)
T3 (final time)
Date: (blank)
Time: (blank)
1.0 M NaCl (blank) (blank) (blank) (blank)
0.25 M NaCl (blank) (blank) (blank) (blank)
distilled water (blank) (blank) (blank) (blank)
control (blank) (blank) (blank) (blank)

Step 7. After 30 minutes, observe the four cups. Observe each bear's appearance for T1 (timepoint 1).

Step 8. Gently remove each bear with the appropriately labeled spoon and place it on a paper towel to drain. Be careful not to press or squeeze the bears.

Step 9. Update Table 1 and Table 2 with the correct date and time for T1. Gently take the mass of each bear. Record the mass of all bears into Table 1. Describe changes in each bear's appearance or texture in Table 2. If no changes in appearance are detectable, write "No change." Return bears to their solutions.

Step 10. Over the next 23 hours, take two more measurements. At each measurement, remove and mass the bears. Record the mass in Table 1 and appearance in Table 2. The final measurement, at timepoint 3 (T3), should occur approximately 24 hours after T0. The measurement for timepoint 2 (T2) can happen anytime between T1 and T3, but, if possible, aim for 3–8 hours after T0.

Step 11. After taking your final measurement at T3, determine the net change in mass for each gummy bear by subtracting the mass at T0 from the mass at T3. Record the net change in mass for each gummy bear in Table 1.

Part 3 : Post-lab Questions

Answer the following questions about your experiment.

  1. Briefly summarize your results from each of the three solutions. Then, review your answers to the pre-lab questions. Do you think your results suggest the gummy bears are semipermeable (permeable to water but not NaCl) or fully permeable (permeable to both water and NaCl)?

  2. Abigail is planning to cook a pot of beans. First, she'll soak her beans overnight. She adds salt to the soak water to improve the flavor of the beans. However, after a 12-hour soak, Abigail notices the beans have swelled very little. Refer to your experimental result to explain to Abigail what likely occurred; what could she do now?

  3. Centuries ago, people observed that adding salt to a field of crops reduced plant growth immediately and in the following years. What effect might salty soil have on plants? Explain your answer using the term "hypertonic."

  4. Based on your findings, what is most likely to happen to red blood cells placed in distilled water?

    1. The red blood cells will swell and could potentially burst due to the movement of water into them.

    2. The red blood cells will shrink and shrivel up due to the movement of water out of them.

    3. The red blood cells will remain the same size since they are in clean water.

    4. The red blood cells will shrink or shrivel up because they are in a hypertonic environment.

To submit this project, submit answers to the pre-lab and post-lab questions and the completed Tables 1 and 2.

Project Materials

  • 4 gummy bears (same color)

  • Approximately 20 g NaCl (table salt, not iodized)

  • 4 clear plastic cups, about 250 mL

  • 4 disposable spoons

  • Distilled water (Don't substitute with tap or "spring" water.)

  • Fine-tipped permanent marker

  • Scale or balance

Student Checklist


Chapter 6 Project

Bioenergetics through Enzymatic Activity

Project Goal + Timeline

In this project, we will be reviewing your knowledge on enzymatic activity. We'll do this with a simple experiment with hydrogen peroxide (H2O2) and the enzyme catalase. This project should be completed within a group of 2–3 students in a two-hour time frame.

Hydrogen peroxide (H2O2) is a chemical compound produced as a byproduct of metabolic reactions in cells. If not removed from the cell, hydrogen peroxide can attack and damage cellular components, such as proteins and nucleic acid. The cellular enzyme catalase neutralizes hydrogen peroxide by decomposing it into water (H2O) and oxygen gas (O2).

In this experiment, you'll use catalase from potatoes to examine how temperature affects enzymatic activity. In your experiment, you'll be able to visualize the oxygen gas produced by the reaction as bubbles in water.

Directions

Part 1: Catalase Activity Experiment

Follow these steps to complete your experiment.

  1. Use masking tape and a marker to label one large and one small test tube with "cold temperature," one large and one small test tube with "room temperature," and one large and one small test tube with "boiling temperature."

  2. Prepare a hot water bath by filling a 400 mL beaker approximately two-thirds full water and placing it on a hot plate.

  3. Add 5 mL (1 teaspoon) of water to each large tube.

  4. Cut three cubes of potato, each with an edge length of approximately 2 centimeters. Remember: the cubes should be the same size to obtain the same amount of catalase in each reaction tube.

  5. Place one potato cube in the water in each of the three large tubes.

  6. Place the tube labeled "cold water" in a freezer or refrigerator for 5 minutes. Carefully place the tube labeled "boiling water" in the hot water bath for 5 minutes. Let the tube labeled "room temperature" sit out for 5 minutes.

  7. Add 5 mL of hydrogen peroxide to each of the labeled small test tubes.

  8. Remove the "cold water" tube from the freezer. Use tongs to carefully remove the "boiling water" tube from the hot water bath and place it in a test tube rack.

  9. Add the 5 mL of hydrogen peroxide from the small test tubes to each of the large test tubes. Start timing the reaction when the hydrogen peroxide is added.

  10. Measure the time, in seconds, between when you added the hydrogen peroxide and when you saw the first bubbles in the test tube. Record the time for each tube in Table 1. If no bubbles are detected, write "no reaction."

  11. Observe the strength of the reaction: are the bubbles forming rapidly or slowly? Rate the strength of the reaction on a scale from 1 to 5 (1 being weak and 5 being strong). Record your strength rating in Table 1. If no bubbles are detected, write "no reaction."

TABLE 1
Cold Temperature Room Temperature Boiling Temperature
Reaction Speed (sec) (blank) (blank) (blank)
Reaction Strength (1–5) (blank) (blank) (blank)

Part 2: Data Analysis

Use the data in the table to create two graphs. Make sure to include a title for each graph.

  1. Create Graph 1 of the reaction speed versus the reaction temperature. In the graph, the y-axis will be the speed of bubble formation (in seconds), and the x-axis will be the relative temperature (cold, room, boiling).

  2. Create Graph 2 of the reaction strength versus the reaction temperature. In the graph, the y-axis will be the strength of bubble formation, and the x-axis will be the relative temperature (cold, room, boiling).

Part 3: Post-experiment Questions

  1. What is the equation for the reaction catalyzed by catalase? In the equation, label the reactants and the products.

  2. Define the independent variable (i.e., what was changed) and the dependent variable (i.e., what was measured) in the experiment.

  3. How did you measure enzymatic activity in your experiment?

  4. Describe the results of your experiment. What do your results reveal about catalase activity?

  5. Was the catalase denatured at any of the temperatures tested? Provide evidence to support your answer.

  6. The activity of catalase is greatest at a temp erature of approximately 35℃. How might this optimum temperature contribute to catalase's physiological function?

  7. Explain any sources of error in this experiment. How could you correct those errors?

Project Materials

  • 6 test tubes (3 small and 3 large). If test tubes are no available, other heat-proof containers may be used.

  • Test tube rack

  • Potato

  • Knife

  • Graduated cylinder or measuring spoons

  • Hot water bath (beaker and hot plate)

  • Tongs (to remove the test tube from the hot water bath)

  • Access to a refrigerator or freezer

  • Hydrogen peroxide (3%)

  • Masking tape

  • Fine-tipped marker

  • Stopwatch or other timing device

  • Graphing software or graph paper

  • Table for recording data

Student Checklist


Chapter 7 Project

Aerobic and Anaerobic Respiration in Yeast

Project Goal + Timeline

In this project, we will be reviewing your knowledge on cellular respiration and fermentation by performing a simple experiment with yeast. This project should be completed within a group of two to three students in a two-hour time frame.

Yeasts are unicellular eukaryotic organisms that can undergo either aerobic respiration or fermentation. Yeasts have exceptional commercial importance, largely due to their fermentation ability. Applications of yeast fermentation range from the brewing of spirits to the production of biofuel.

In this project, you will first perform an experiment to examine how supplementation with sugar affects fermentation in yeast. Then, you'll graph your data and use it to draw conclusions. You'll finish by reviewing your knowledge of respiration and fermentation.

Directions

Part 1: The Yeast Respiration Experiment

Follow the steps to complete your experiment.

  1. Yeast Activation

    1. Label one 10 mL graduated plastic tube "+sugar" and one "-sugar."

    2. In one of the empty cups, combine ¼ teaspoon of dry yeast and 20 mL (4 teaspoons) of warm water (-sugar).

    3. Mix thoroughly with the stir stick.

    4. In the other empty cup, combine ¼ teaspoon of dry yeast, 1 teaspoon of sugar, and 20 mL (4 teaspoons) of warm water (+sugar).

    5. Mix thoroughly with the stir stick.

    6. Wait 5 to 10 minutes to allow the yeast to activate.

  2. Measurement of CO2 Production

    1. Pour the -sugar mixture into the tube labeled "-sugar" and the +sugar mixture into the tube labeled "+sugar". Fill each tube to the top if possible. Screw the cap on slowly.

    2. Turn both tubes upside down. Make sure the tubes are completely filled with the mixture. If the tube is not completely filled, add more of the correct solution to the tube. Place both upside-down tubes inside of an empty plastic cup.

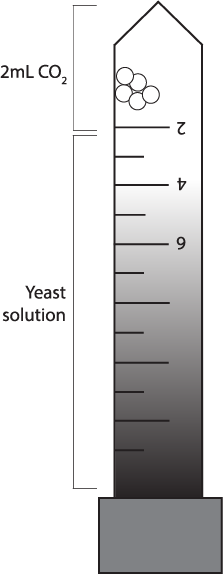
    3. Every 2 minutes, measure the volume at the tip of the test tube that is occupied by bubbles (CO2). Record the volume in Table 1.

TABLE 1: Volume of CO2 Produced by Yeast in the Presence and Absence of Sugar
Time (minutes) Volume of CO2 Produced (mL)
-sugar +sugar
2 (blank) (blank)
4 (blank) (blank)
6 (blank) (blank)
8 (blank) (blank)
10 (blank) (blank)
12 (blank) (blank)
A ruler for measuring CO2 and yeast solution

The ruler is divided into 6 full marks with half marks in between. The marks start with 2 and then go to 4 and then 6. The tip of the ruler to 2 is marked as 2mL CO2. 2 to the end of the ruler (approximately 14) is marked as Yeast solution.

Part 2: Data Analysis

Use the data in the table to make two graphs. Make sure to include a title for each graph. For each graph, plot the time (in minutes) on the x-axis and the volume of CO2, in milliliters on the y-axis.

  1. Graph 1: Plot the results of the -sugar treatment.

  2. Graph 2: Plot the results of the +sugar treatment.

Part 3: Post-experiment Questions

  1. Describe how aerobic respiration and fermentation are related.

  2. What was the purpose of covering each tube with a lid in the experiment?

  3. Define the control group, the independent variable (what was changed), and the dependent variable (what was measured) in the experiment.

  4. Describe how you measured the rate of cellular respiration during the experiment.

  5. Summarize your results and state the overall conclusion from your experiment.

  6. Explain any sources of error in this experiment. How could you correct those errors?

Part 4: Review Questions

  1. What is the purpose of cellular respiration? Why do living organisms carry out the process of respiration?

  2. In what part of the cell does cellular respiration occur?

  3. What are the two types of fermentation and what is produced in each?

  4. What are the equations for cellular respiration and fermentation? In each equation, label the reactions and products.

  5. What type of fermentation do yeast perform?

  6. What is a facultative anaerobe? How is being a facultative anaerobic advantageous to an organism?

Project Materials

  • 2 graduated laboratory (Falcon) 15 mL tubes with screw-on caps

  • 4 small clear plastic cups

  • Warm water

  • Sugar

  • Active dry yeast

  • 2 stir sticks

  • ¼ teaspoon

  • Teaspoon or graduated cylinder

  • Fine-tipped marker

  • Tape

  • Stopwatch

  • Pen or pencil

  • Graphing software or graph paper

  • Table for recording data

Student Checklist


Chapter 8 Project

Plant Pigment Chromatography

Project Goal + Timeline

In this project, we will be reviewing your knowledge of photosynthesis by conducting a paper chromatography experiment. Most leaves are green due to chlorophyll; this substance is important in photosynthesis (the process by which plants make their food). In this experiment, we will test for various pigments present and separate the pigments using paper chromatography.

Plants produce their own food with the presence of sunlight and carbon dioxide. For photosynthesis to occur, plants contain a green pigment called chlorophyll that absorbs specified wavelengths of sunlight. Chromatography is a process that separates pigment molecules because each pigment has its own solubility levels for a certain solvent (we will use isopropyl alcohol for this task). The most soluble pigment moves farthest when compared to the less soluble pigment. In this experiment, you will use paper chromatography to determine what plant pigments are present in green and red leaves.

This project should be completed by yourself or within a group in a two-hour time frame.

Directions

Part 1: Test Your Knowledge

  1. Which of the following is a green pigment that is present in most plant cells and gives plants their characteristic green color?

    1. carotenoid

    2. chlorophyll

    3. chloroplast

    4. stroma

  2. Write the products and reactants of photosynthesis.

  3. Where is chlorophyll found in a plant cell?

    1. cell wall

    2. cytoplasm

    3. nucleus

    4. chloroplasts

  4. Make a prediction. Why do some leaves appear green in the warmer months and then red/orange in the fall?

Part 2: Conduct Your Experiment

Set up your experiment for both a green and red leaf by following these steps. Use the photos as a guide. Spinach leaves provide the best result for this experiment. However, you may be able to find green leaves from any nearby plant. Find another plant nearby with leaves of another color, preferably red. Please be sure to wear long sleeves and pants when collecting leaves.

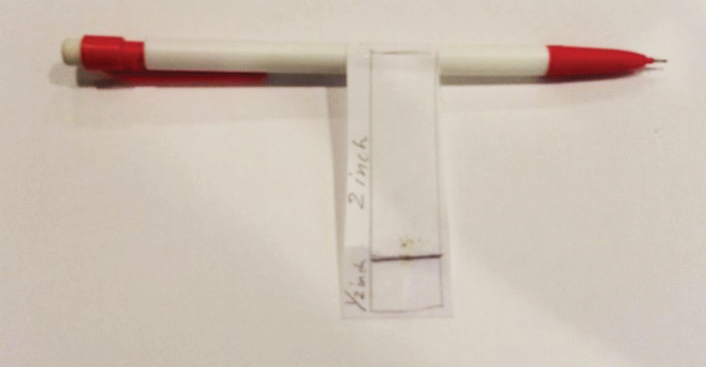
  1. Cut a 2 ½ inch strip from a coffee filter and use a ruler to measure and draw a light pencil line ½ inch above the bottom of the coffee filter strip.

  2. Tape the top of the paper strip to a pencil so that the end of the strip with the line hangs down.

  3. The pencil should be able to sit across the top of the clear cup with the bottom of the paper strip just touching the bottom of the cup.

  4. Cut off any excess paper from the top of the strip if it is too long. Be careful to not cut the bottom of the strip with the line.

    A pencil with a paper tag wrapped around it. The tag shows where a half inch is and 2 inches is.
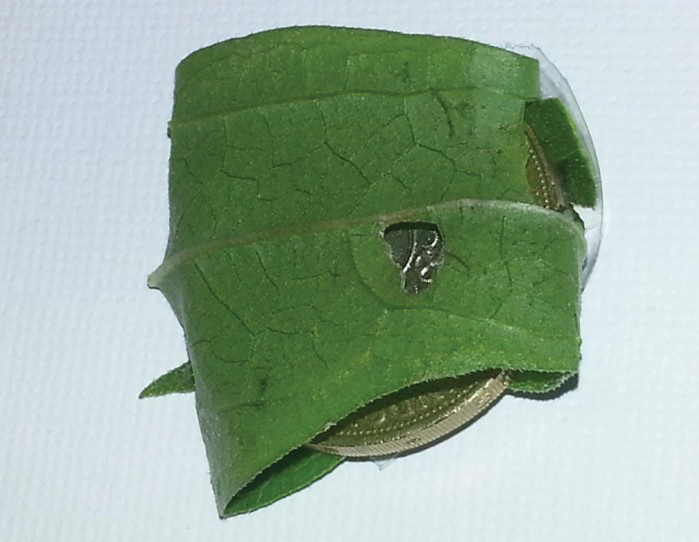
  5. Wrap a leaf around a coin with the waxy side of the leaf facing outward.

    A quarter with a green leaf wrapped around it
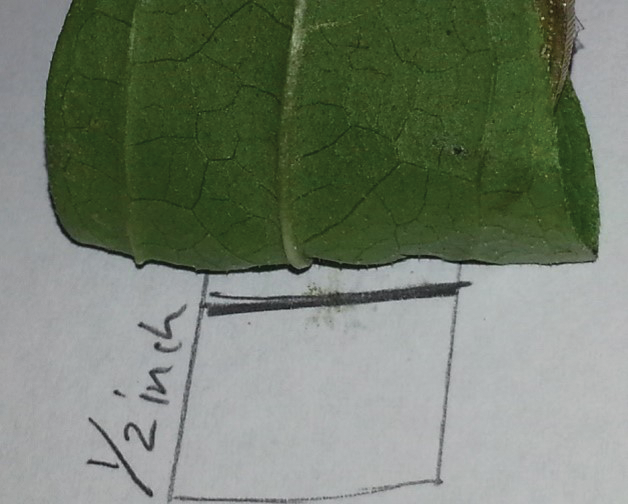
  6. Rub the leaf along the pencil line on the coffee filter strip until you make a dark green or red line. Do not rub the leaf above or below the line. Rub the leaf on the line only.

    The quarter with the leaf wrapped around it and a paper measuring a half inch from the bottom of the quarter
  7. Remove the pencil/paper strip from the clear cup for now.

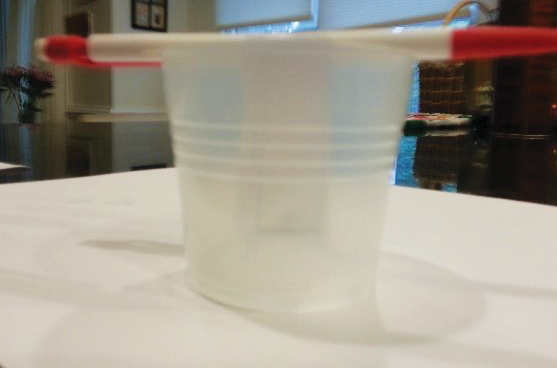
  8. Carefully add isopropyl alcohol to the cup until it reaches a depth of ½ inch. Lay the pencil across the top of the cup with the paper strip extending into the alcohol. Make sure that the level of the alcohol is below the green or red line on your paper strip. If the alcohol is going to cover the green or red line, pour out some alcohol before you get the line wet.

    A clear, plastic cup with a pencil laying across the opening with a paper tag with half inch and 2 inch measurements
  9. Observe as the alcohol gets absorbed and travels up the paper strip. This may take up to 20 minutes. Do not touch your experiment during this time.

  10. When the solvent has traveled to within 1 cm of the top of the paper, remove the paper and mark the furthest point that the solvent traveled. Allow the paper to dry.

  11. Using colored pencils or crayons, draw your results in Table 3. Be sure to dispose the material in an environmentally safe manner.

Part 3: Document Your Results

Complete the following observation tables for both the green and red leaf. Line/Pigment 1 is the mark closest to the bottom of the paper. Use your ruler to measure the distances.

TABLE 1: Chromatography and Pigment Distances of the Green Leaf
Line/Pigment Distance from Bottom of Paper (inches) Color Observed
Pigment origin 1.5 N/A
1 (blank) (blank)
2 (blank) (blank)
3 (blank) (blank)
4 (blank) (blank)
5 (blank) (blank)
TABLE 2: Chromatography and Pigment Distances of the Red Leaf
Line/Pigment Distance from Bottom of Paper (inches) Color Observed
Pigment origin 1.5 N/A
1 (blank) (blank)
2 (blank) (blank)
3 (blank) (blank)
4 (blank) (blank)
5 (blank) (blank)

Sketch your two chromatograms for each leaf in the following table. Be sure to label the colored lines with distance.

TABLE 3: Chromatograms of Green and Red Leaves
Use colored pencils or crayons to draw your observations in the spaces below.
green leaf (blank)
red leaf (blank)

Part 4: Analyze Your Results

  1. Did the leaves you tested contain different pigments?

  2. Why is paper chromatography an appropriate technique for determining if different pigments are present in a leaf?

  3. From your results, what are the two major types of pigments observed? How does each contribute to the process of photosynthesis?

  4. Based on your results, explain why leaves tend to change color. Leaves in New England change color in autumn. However, leaves in Florida do not change colors in the same way. Why is this? (Hint: Think of a difference between the two locations that might act as a trigger for leaves to change color in the fall.) Could this be an evolutionary adaptation for the leaves? How so?

Project Materials

  • Coffee filter

  • Ruler

  • Scissors

  • Pencil

  • Colored pencil or crayons

  • Scotch tape

  • Green leaves (spinach yields the best results)

  • Red leaf (or color other than green)

  • Coin, such as a quarter

  • 8 oz clear plastic cup

  • 70% isopropyl alcohol (rubbing alcohol)

Student Checklist


Chapter 9 Project

Tricky Taste Buds

Project Goal + Timeline

In this project, we will be reviewing your knowledge of cell communication with a simple taste experiment. This project should be completed in a group of two students within a two-hour time frame.

Taste perception is due to the interaction of taste molecules in foods (tastants) with taste receptor cells. These cells, which are bundled in clusters called taste buds, have specialized receptors on their surfaces that respond to particular tastants. For example, sweet taste receptors respond to sugar and similar molecules, while bitter taste receptors respond to compounds call alkaloids. The binding of a tastant to a particular receptor stimulates a change in the cell that is transduced to the nervous system to give you the perception of the particular taste.

Is it possible to confuse these taste receptor cells? In this project, you'll be experimenting with two substances, Gymnema tea and miracle fruit tablets, that can affect the perception of taste. Gymnema tea is made from the leaves of the Gymnema sylvestre plant, a plant native to India and Africa. The miracle fruit tablets contain the compound miraculin, a compound extracted from the berries of the plant Synsepalum dulcificum.

Directions

Part 1: Tricky Taste Buds Experiment

Select one member of your group to be the "Gymnema Tester" and one to be the "Miracle Fruit Tester."

Then, you'll taste eight substances. Have both members of your group taste each substance. In between each substance, rinse your mouth with water.

Taste the following substances in the given order. As you taste each substance, rate each for the perception of sweet, sour, salt, and bitter on a scale from 0 to 5 in the appropriate "Before" row of Table 1 for each substance. (For example, the "Gymnema tester" will complete the "Before tea" row for each substance.) The rating 0 represents no perceived taste while the rating of 5 represents a very intense taste.

  • Salt

  • Aspartame

  • Raw broccoli

  • Sugar

  • Chocolate candy

  • Lemon wedge

  • Apple cider vinegar

  • Sweet cereal bar

After you've tasted each substance once, get a sample of Gymnema tea and a sample of the miracle fruit tablet.

  • For the "Gymnema Tester," hold one ounce of tea in your mouth for 30 seconds. Make sure the tea contacts all areas of the mouth. Then, spit the tea into the sink and rinse your mouth with water.

  • For the "Miracle Fruit Tester," allow the tablet to dissolve on your tongue without chewing it, then swish it around your mouth.

Next, have both group members retaste each of the samples, starting with salt and following the order in the list. Continue to rate each sample for each of the taste perceptions on the scale from 0 to 5 to complete Table 1.

TABLE 1: Taste Perceptions Before and After Treatment with Gymnema Tea and Miracle Fruit
Taste ratings (0–5)
Substance Sweet Sour Salty Bitter
Salt Before tea (blank) (blank) (blank) (blank)
After tea (blank) (blank) (blank) (blank)
Before miracle fruit (blank) (blank) (blank) (blank)
After miracle fruit (blank) (blank) (blank) (blank)
Aspartame Before tea (blank) (blank) (blank) (blank)
After tea (blank) (blank) (blank) (blank)
Before miracle fruit (blank) (blank) (blank) (blank)
After miracle fruit (blank) (blank) (blank) (blank)
Raw broccoli Before tea (blank) (blank) (blank) (blank)
After tea (blank) (blank) (blank) (blank)
Before miracle fruit (blank) (blank) (blank) (blank)
After miracle fruit (blank) (blank) (blank) (blank)
Sugar Before tea (blank) (blank) (blank) (blank)
After tea (blank) (blank) (blank) (blank)
Before miracle fruit (blank) (blank) (blank) (blank)
After miracle fruit (blank) (blank) (blank) (blank)
Chocolate candy Before tea (blank) (blank) (blank) (blank)
After tea (blank) (blank) (blank) (blank)
Before miracle fruit (blank) (blank) (blank) (blank)
After miracle fruit (blank) (blank) (blank) (blank)
Lemon wedge Before tea (blank) (blank) (blank) (blank)
After tea (blank) (blank) (blank) (blank)
Before miracle fruit (blank) (blank) (blank) (blank)
After miracle fruit (blank) (blank) (blank) (blank)
Apple cider vinegar Before tea (blank) (blank) (blank) (blank)
After tea (blank) (blank) (blank) (blank)
Before miracle fruit (blank) (blank) (blank) (blank)
After miracle fruit (blank) (blank) (blank) (blank)
Sweet cereal bar Before tea (blank) (blank) (blank) (blank)
After tea (blank) (blank) (blank) (blank)
Before miracle fruit (blank) (blank) (blank) (blank)
After miracle fruit (blank) (blank) (blank) (blank)

Part 2: Conclusion Questions

  1. For each substance, compare the taste ratings from before the treatment with the Gymnema tea to the taste rating after the treatment with the Gymnema tea.

  2. For each substance, compare the taste ratings from before the treatment with miracle fruit to the taste rating after the treatment with miracle fruit.

  3. Based on your response to question 1, what can you conclude about how Gymnema tea affects the sense of taste? Which types of taste were altered?

  4. Based on your response to question 2, what can you conclude about how miracle fruit affects the sense of taste? Which types of taste were altered?

  5. What might be the possible mechanism for the effect of Gymnema on the perception of taste?

  6. What might be the possible mechanism for the effect of miracle fruit on the perception of taste?

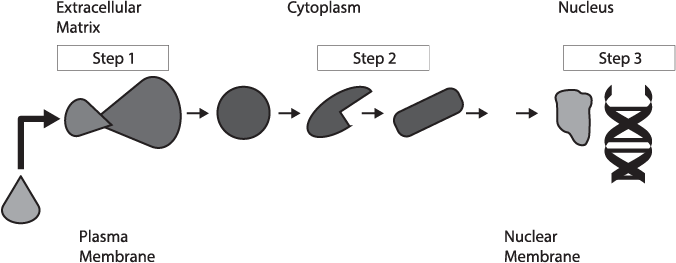
  7. The following shows a generic signal transduction pathway. Briefly identify and explain each step in the pathway.

    A diagram of the signal transduction pathway

    The diagram starts with a teardrop shape entering another shape. This is labeled "Step 1" with the "Extracellular Matrix" label above and the "Plasma Membrane" label below. This then points to a circle and then to a circle with a piece missing, which then points to a rodlike shape. This is labeled "Step 2" with the "Cytoplasm" label above. Then there is an arrow pointing to another arrow, which is labeled "Nuclear Membrane" below. Lastly, the arrow points to a blob-like shape with an image of DNA next to it. This is labeled as "Step 3."

Project Materials

  • Salt

  • Aspartame

  • Raw broccoli

  • Sugar

  • Chocolate candy

  • Lemon wedge

  • Apple cider vinegar

  • Sweet cereal bar

  • Gymnema tea

  • Miracle fruit tablets

  • Pen or pencil

  • Table and questions

Student Checklist


Chapter 10 Project

Cyclin Round the Cell

Project Goal + Timeline

In this project, you will reinforce what you have learned about the cell cycle and mitosis by examining the consequences of mutations and/or disruptions to these processes. You'll recapitulate the process through which much of this knowledge was gained in the first place—through careful examination of mutants and disorders in our species and others. The initial phase of this project, applying your knowledge, will be short. The second part, making predictions and then finding information in the OMIM database, may take one to two hours. Finally, you may spend several days working with a partner to put together an appropriate presentation on a particular gene. This project should help you draw connections between the material and important human disorders.

Directions

Eukaryotes, such as Homo sapiens (us!), need to carefully control cell division. Not only do cells need to divide at the appropriate times, but the act of replicating, aligning, and separating 46 individual chromosomes is a precisely controlled molecular ballet. The importance of all the factors involved, particularly cell-cycle checkpoints, is underscored by the symptoms and disorders that result when one or more factors do not work properly.

Part 1: Apply Your Knowledge

  1. What specific molecules or factors in the cell are involved in the process of cell division and mitosis?

  2. What diseases or disorders do you think might develop from improper timing or mechanics in cell division?

Part 2: Use OMIM to Investigate Gene Variations

To examine variations in human genes for cell-cycle control, you will utilize the "Online Mendelian Inheritance in Man" database, or OMIM. Entries in this database will contain basic information on a particular gene, often accompanied with information on the variants or alleles that exist for it and how they contribute to different phenotypes.

To begin, you should fill out the following table as an outline. In the "role" and "prediction" columns, use your knowledge of biology to describe the role of each factor or gene as well as a prediction for what would result from a mutation of the factor or gene. Then, search OMIM to locate specific mutations and their associated diseases to complete the remainder of the table. For many factors involved in the cell cycle, there may exist multiple forms of each, and then different variants or alleles of each form. If you are working with a partner, you should each select a different gene and/or form and then examine different alleles.

TABLE 1
Factor/Gene Role Prediction for Mutant Form OMIM Representative Associated Diseases
Kinetochore (blank) (blank) (blank) (blank)
Mitotic Spindle (blank) (blank) (blank) (blank)
Condensin (blank) (blank) (blank) (blank)
Cyclin A/Cdk2 (blank) (blank) (blank) (blank)
Cyclin D/Cdk4 (blank) (blank) (blank) (blank)
Cyclin E/Cdk2 (blank) (blank) (blank) (blank)
DNA Polymerase (blank) (blank) (blank) (blank)
Another Factor of Your Choice:(blank) (blank) (blank) (blank) (blank)

Compare your results for each of the above genes with a partner.

  1. Did the findings from OMIM match your predictions? Why or why not?

Part 3: Present Your Findings

Finally, you should pick one of the categories/rows in Table 1 and develop a 10-minute presentation about it to highlight the importance of that factor for the rest of the class. In your presentation, you should focus on doing the following:

  • Establish and describe the role the factor has in the cell cycle, emphasizing its importance.

  • Talk about the different forms of the gene you found. Some of these exist as multiple forms or have accessory proteins that form a complex. Describe these in more detail for one specific case.

  • Highlight at least one disorder or condition that results from having an allele for one of the genes involved in the role you are describing. Make sure to connect the phenotype observed to the role the gene has!

Project Materials

  • Project worksheet and a pen, or a computer with a word processor

  • Access to OMIM

  • Presentation software, such as PowerPoint

Student Checklist


Chapter 11 Project

Modeling Meiosis

Project Goal + Timeline

In this project, we will be reviewing your knowledge on meiosis and sexual reproduction. You'll do this by modeling the process of meiosis using beads, string, and magnets. This project should be completed by yourself or within a group in a two-hour time frame.

Directions

Part 1: Create Chromosome Models

First, you'll construct your chromosome models. In Steps 1 and 2, you'll create two homologous, large chromosomes. In Steps 3 and 4, you'll create two homologous, small chromosomes.

  1. Attach 5 yellow pop beads to each side of the magnetic centromere. When you are done, you should have a string of 10 yellow pop beads with the magnetic centromere in the middle. Then repeat this process to create two identical sister chromatids of a single chromosome.

  2. Repeat the previous step with red beads. This step will create two identical sister chromatids of a chromosome homologous to that created in Step 1.

  3. Repeat Step 1, except use 3 yellow beads on one side of the magnetic centromere and 2 on the other side. When you are done, you should have a string of 5 beads with the magnetic centromere between the third and fourth bead. Then repeat this process to create two identical sister chromatids of a single chromosome.

  4. Repeat Step 3 with red beads. This step will create two identical sister chromatids of a chromosome homologous to that created in Step 3.

After completing the steps, you'll be able to model a parental cell containing 2 pairs of homologous chromosomes (one large chromosome and one small chromosome). Use a piece of string to make a large circle around your chromosomes. Clump your chromosomes together (like chromatin). The entire model represents the chromosomes in a cell during interphase.

Part 2: Model Meiosis

You're starting with a parental cell with 2 pairs of homologous chromosomes. You'll use your chromosomes to model each phase of meiosis I and II. As you model each phase, sketch your model in the appropriate cell in Table 1.

  1. Model each of the following stages of meiosis I.

    • Prophase I:

      • Condense your chromatin into chromosomes connected at their centromeres. You should create four condensed chromosomes (one large red, one large yellow, one small red, one small yellow).

      • Model chromosomal crossover between chromatids of the homologous pairs. Exchange beads from one chromatid on the large, yellow chromosome with beads from one chromatid on the large, red chromosome. Likewise, exchange beads from one chromatid on the small, yellow chromosome with one chromatid on the small, red chromosome. This exchange should generate non-identical sister chromatids.

    • Metaphase I: Line the homologous chromosomes up on the center of the cell (the two large, homologous chromosomes together and the two small, homologous chromosomes together).

    • Anaphase I: Pull one homologous chromosome from each of the large and small pairs to opposite sides of the cell.

    • Telophase and Cytokinesis I: Use the string to form two circles, one around each set of chromosomes.

  2. Model each of the following stages of meiosis II.

    • Prophase II: Arrange the chromosomes in homologous pairs in the center of each of the two cells.

    • Metaphase II: Line up each chromosome pair in the center of the cell.

    • Anaphase II: Pull the sister chromatids apart and move each sister chromatid to the opposite side of the cell.

    • Telophase and Cytokinesis II: Use the string to form a total of four circles, one around each set of unique sister chromatids.

TABLE 1: Stages of Meiosis
(blank) (blank) (blank) (blank)
Prophase I Metaphase I Anaphase I Telophase I and Cytokinesis I
(blank) (blank) (blank) (blank)
Prophase II Metaphase II Anaphase II Telophase I and Cytokinesis II

Part 3: Review Meiosis

  1. How are meiosis I and II different? Why, if they are different, do they have the same name?

  2. What cell features essential to meiosis were not represented by your model? What is the role of this feature in meiosis?

  3. Explain linked genes and describe the effect of crossing over on linked genes. What is a benefit of crossing over?

  4. Why is meiosis important for sexual reproduction? Does meiosis also occur in asexual reproduction?

  5. Why is meiosis an advantage for evolution? Does it provide an evolutionary advantage over mitosis?

  6. A human has 23 pairs of chromosomes, or 46 total chromosomes. In a human, how many chromosomes are in each daughter cell after meiosis I and after meiosis II, and how do these daughter cells differ? Are the daughter cells 1n or 2n?

  7. Are the daughter cells produced by meiosis identical? Why or why not?

  8. What are oogenesis and spermatogenesis? How are they different?

  9. In humans, where in the body does meiosis occur in males and in females?

  10. Complete Table 2 to summarize the differences of mitosis and meiosis.

TABLE 2
Mitosis Meiosis
Chromosome number of parent cells (n or 2n) (blank) (blank)
Number of daughter cells produced (blank) (blank)
Chromosome number of daughter cells (n or 2n) (blank) (blank)
Present in sexual or asexual reproduction (blank) (blank)
Crossing over (blank) (blank)

Project Materials

  • 1 data table and corresponding questions

  • Pop beads of two different colors

  • Magnetic centromeres

  • String

  • Scissors

  • Pen or pencil

Student Checklist


Chapter 12 Project

Let's Create a Dog!

Project Goal + Timeline

In this project, we will be reviewing your knowledge of Mendelian and non-Mendelian inheritance by creating and evaluating a series of hypothetical allele combinations passed down by two dogs to their offspring. This project should be completed by yourself or within a group in a two-hour time frame.

Directions

Part 1: Design Your Dog

In this part, you'll fill out Table 1 to design your dog based on the traits of the parental dogs. You'll use the genotypes of the parents to predict a possible genotype and phenotype for each of the offspring's traits.

For each trait, you are given the genotype of each parent dog. You can assume complete dominance for each of these traits. In cases where the parent dogs are homozygous for a trait, they will pass down that allele to their offspring, so the genotype of the offspring must include that allele. If the parent dogs are heterozygous for a trait, you will flip a coin to determine if they pass down either the dominant or recessive allele to their offspring. If the coin lands on heads, the dominant allele is passed on. If the coin lands on tails, the recessive allele is passed on.

For each trait, draw a Punnett square for the cross of the parents on a separate piece of paper. Use your Punnett square to determine the probability of the genotype and phenotype your offspring ended up with based on the coin toss. Record that information in the table.

Trait Dominant Phenotype Recessive Phenotype Genotype of Parent 1 Genotype of Parent 2 Genotype of Offspring Probability of Genotype Phenotype of Offspring Probability of Phenotype
height tall (H) short (h) Hh hh (blank) (blank) (blank) (blank)
weight heavy (W) thin (w) WW ww (blank) (blank) (blank) (blank)
eye color brown (B) blue (b) Bb Bb (blank) (blank) (blank) (blank)
coat color black (C) white (c) Cc cc (blank) (blank) (blank) (blank)
coat texture straight (T) curly (t) tt tt (blank) (blank) (blank) (blank)
snout long (S) short (s) Ss SS (blank) (blank) (blank) (blank)
ears floppy (E) pointed (e) Ee Ee (blank) (blank) (blank) (blank)
nose color black (N) pink (n) NN nn (blank) (blank) (blank) (blank)
nail color white (A) black (a) AA AA (blank) (blank) (blank) (blank)
tail short (L) long (l) ll Ll (blank) (blank) (blank) (blank)

After you complete the table, answer the following questions:

  1. What is the probability of creating another offspring that has the same genotypes as the one you created?

  2. What is the probability of creating another offspring that has the same phenotypes as the one you created?

  3. Compare your offspring to the rest of the class. Who has the rarest offspring and why?

  4. Draw a picture of your dog!

Part 2: Non-Mendelian Genetics

Answer the following questions regarding non-Mendelian genetics:

  1. Let's say that instead of the allele for the short tail length being completely dominant to the allele for long tail length, it exhibits incomplete dominance. What would the possible genotypes of the offspring of parents 1 and 2 be? What would the possible phenotypes of these offspring be?

  2. What if the trait for coat color exhibits codominance? What would the possible genotypes and phenotypes of the offspring of parents 1 and 2 be?

Part 3: Pedigree Analysis

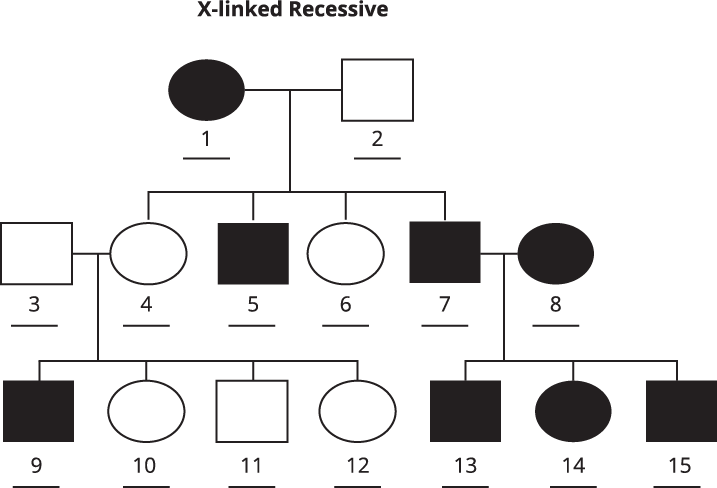
The following pedigree shows the inheritance pattern of the trait of wrinkles in dogs. The gene for this trait is carried on the X chromosome. The absence of wrinkles (XR) is dominant to the presence of wrinkles (Xr). Individuals represented by black circles or squares have wrinkles, while individuals represented by white circles or squares do not have wrinkles. Squares represent males, and circles represent females. The first generation is the parents of your created offspring. The second generation represents the dogs you and your classmates designed. The third generation is the future offspring of your dog!

A pedigree of the created dog

The pedigree is titled "X-linked Recessive." The first generation is the following: 1 is a black circle, and 2 is a white square. The second generation is the following: 4 is a white circle, 5 is a black square, 6 is a white circle, and 7 is a black square. 4 is mated to 3, which is a white square. 7 is mated to 8, which is a black circle. The offspring of 3 and 4 are the following: 9 is a black square, 10 is a white circle, 11 is a white square, and 12 is a white circle. The offspring of 7 and 8 are the following: 13 is a black square, 14 is a black circle, and 15 is a black square.

Analyze the pedigree, then answer the following questions:

  1. Fill in the pedigree to the best of your ability with the possible genotypes of all the individuals. What are the phenotypes of each individual? Mark any heterozygous individuals with a black dot inside of their shape. Hint: Only females without wrinkles (white circles) could be heterozygous, but not all females without wrinkles are heterozygous.

  2. Which of the following best describes the inheritance pattern of the trait of wrinkles?

    1. autosomal recessive

    2. autosomal dominant

    3. sex-linked recessive

    4. sex-linked dominant

  3. What sex chromosomes would a female dog have? What about a male dog?

  4. What is the probability that a second-generation male offspring will have wrinkles? What is the probability that a second-generation female offspring will have wrinkles?

  5. If a male in the second generation has wrinkles, can the male pass this trait along to future offspring (offspring in the third generation)? Could a female offspring without wrinkles in the second generation pass the trait of wrinkles to the third generation?

  6. Flip your coin one last time. Heads, your dog is a male. Tails, your dog is a female. Given the genotypes of the parents in the first row of the previous pedigree, what is the probability that your dog has wrinkles?

Project Materials

  • Data table and corresponding questions

  • Blank sheets of paper

  • A coin

  • Pen or pencil

Student Checklist


Chapter 13 Project

Genetic Shuffle

Project Goal + Timeline

In this project, you will simulate genetic assortment during meiosis and fertilization to examine sources of genetic diversity. You'll apply what you've learned about meiosis, crossing over, and independent assortment in an interactive way that is rooted in the modern, molecular understanding of these phenomena. This project will help demonstrate the mechanisms behind the huge amount of genetic diversity possible in eukaryotes. This project should take about two hours to complete and is best completed with a partner or larger group.

Directions

Eukaryotes with a sexual life cycle, existing as diploid cells but reproducing through the fusion of haploid cells, have a tremendous amount of genetic diversity. This diversity comes about through a variety of means, and you will simulate some of these processes here.

Although we have many thousands of genes, arrayed across 22 pairs of homologous chromosomes and one pair of sex chromosomes, your simulation will employ a simpler model. We will consider 6 genes across 2 pairs of homologous chromosomes. You can represent the chromosomes and genes in a variety of ways, such as by using cards or Play Doh, or just by recording alleles for the genes. We'll identify the genes as genes A through F. We'll assume each gene has two alleles (for example, A and a) with the uppercase allele (e.g., A) dominant to the lowercase allele (e.g., a). We'll also assume each gene is associated with a single trait. For example, allele A results in trait A.

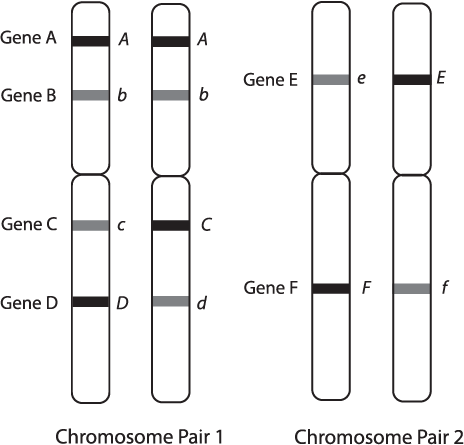
Let's suppose genes A through D are located on chromosome pair 1, while genes E and F are located on chromosome pair 2. The figure shows the arrangement of the genes on the chromosomes, along with a hypothetical pair of alleles for each gene.

Illustrations of two chromosome pairs

The first chromosome pair features genes A, B, C, and D. The first chromosome in that pair is A, then b, then c, and then D. The second chromosome in that pair is A, then b, then C, and then d. The second chromosome pair features genes E and F. The first chromosome in that pair is e and then F. The second chromosome in that pair is E and then f.

You will create a diploid genotype for an individual, and your partner will do the same. If you would like a random genotype, you should roll a die for the alleles for each gene. To do so, first roll a die for each gene on one homologous chromosome of chromosome pair 1 and chromosome pair 2. If you roll a 1 through 4, it should be the dominant allele, and if you roll a 5 or 6 it should be the recessive allele. Then, repeat this process for each of the genes on the other homologous chromosome of both pairs.

You can represent the genotype on the following table.

TABLE 1: Diploid Genotype for Six Genes
Gene and Position Allele on Paternal Homolog Allele on Maternal Homolog
A, chromosome 1 position 1 (blank) (blank)
B, chromosome 1 position 2 (blank) (blank)
C, chromosome 1 position 3 (blank) (blank)
D, chromosome 1 position 4 (blank) (blank)
E, chromosome 2 position 1 (blank) (blank)
F, chromosome 2 position 2 (blank) (blank)

If you are using cards or another material to represent these traits, you should do so in a clear manner and have them set up and ready for meiosis. Based on this first step, answer the following questions:

  1. What is the genotype of your individual? Please make a note of the order of the alleles on each homologous chromosome for both chromosomes.

  2. Does the individual express the dominant or recessive phenotype associated with each gene?

Now, let's simulate meiosis. You will produce 4 gametes for each cell undergoing this process. First, however, we need to replicate each chromosome and pair these homologous pairs up through synapsis of prophase I. During this step, crossing over can occur. If this happens, you should swap the alleles at a particular point but only between two sets of nonsister chromatids. Before simulating crossing over, you will need to rewrite the genotypes you recorded in Table 1 in duplicate to represent the sister chromatids. You can do this in the first part of Table 2 (the "Before Crossing Over" section).

Now, you will simulate crossing over. Roll a die. If you roll a 2, you have crossing over occuring between the positions of genes A and B. To reflect this, the alleles of genes B, C, and D should be switched between two nonsister chromatids (between a sister chromatid of a paternal homolog and a sister chromatid of a maternal homolog). Rolling a 3 is a crossover event between the positions of genes B and C, so you should switch the alleles of genes C and D between two nonsister chromatids. Rolling a 4 is a crossover event between the position of genes C and D, so you should switch the alleles of gene D between two nonsister chromatids. Rolling a 5 is a crossover event between genes E and F, so you should switch the alleles of gene F between two nonsister chromatids. Rolling a 1 represents no crossover, while rolling a 6 represents a double crossover event; first between genes A and B and then again between genes B and C, so you only switch the alleles of B between the two nonsister chromatids.

TABLE 2: Results of Crossing Over
Before Crossing Over After Crossing Over
Paternal Homolog Maternal Homolog Paternal Homolog Maternal Homolog
Gene Sister Chromatid Sister Chromatid Sister Chromatid Sister Chromatid Sister Chromatid Sister Chromatid Sister Chromatid Sister Chromatid
A (blank) (blank) (blank) (blank) (blank) (blank) (blank) (blank)
B (blank) (blank) (blank) (blank) (blank) (blank) (blank) (blank)
C (blank) (blank) (blank) (blank) (blank) (blank) (blank) (blank)
D (blank) (blank) (blank) (blank) (blank) (blank) (blank) (blank)
E (blank) (blank) (blank) (blank) (blank) (blank) (blank) (blank)
F (blank) (blank) (blank) (blank) (blank) (blank) (blank) (blank)

Compare your results for each of the previous genes with a partner. Finally, you will simulate independent assortment to create 4 gametes from meiosis. To determine the genotype of each gamete, roll a die. If you roll an even number, don't take any action. The chromosomes will assort as you have written in Table 2, so you can copy the "After Crossing Over" results into Table 3 to represent the genotypes of your four gametes. However, if you roll an odd number, you'll switch the paternal homolog alleles for genes E and F with the maternal homolog alleles for genes E and F before entering the results in Table 3. This will simulate the chromosomes sorting independently of one another to form daughter cells. Now, you can write the final four columns again to specify the four possible gametes you have created in Table 3.

Now, you and your partner will each have four gametes after crossing over and independent assortment. Both of you will need to select one gamete to combine in fertilization. (You can do this separately.) Roll the die once; rolling between a 1 and a 4 will select which gamete you produced that is used in the fertilization event. If you roll a 5 or 6, try again. Your partner will do the same, creating (most likely) a different fertilization event.

TABLE 3: Independent Assortment and Fertilization
Before Fertilization After Fertilization
Gene Gamete 1 Gamete 2 Gamete 3 Gamete 4 (blank) (blank)
A (blank) (blank) (blank) (blank) (blank) (blank)
B (blank) (blank) (blank) (blank) (blank) (blank)
C (blank) (blank) (blank) (blank) (blank) (blank)
D (blank) (blank) (blank) (blank) (blank) (blank)
E (blank) (blank) (blank) (blank) (blank) (blank)
F (blank) (blank) (blank) (blank) (blank) (blank)

You and your partner have now created two new diploid organisms from the same set of four gametes. Based on your results, please answer the following questions:

  1. Based on what you did in this simulation, what is the relationship between the two offspring or fertilization events? How are they related?

  2. What are the similarities between the two offspring you produced? Write their genotype and their phenotype.

  3. Consider the original chromosome pairs you designed in Table 1. How many possibilities were there for the genotypes of the gametes, assuming crossing over did not occur? Based on this value, how many total possibilities were there for the genotypes of the offspring produced by fertilization, also assuming crossing over did not occur?

  4. How did crossing over affect the number of possible genetically distinct gametes that could be produced? How does this mechanism affect the possible genotypes of the offspring?

  5. In the simulation, how did the distance between linked genes affect the chance that the alleles for the genes would become unlinked by a crossing over event? How did this aspect of the simulation relate to the actual effect of genetic distance on the frequency with which linked genes become unlinked?

You should summarize your results by drawing a depiction of the cells involved, drawing the different homologous chromosomes as they progress through meiosis I, meiosis II, and fertilization.

Project Materials

  • Project worksheet and a pen, or a computer with a word processor

  • At least one 6-sided die

  • A partner

  • Optional: index cards, Play Doh, or some other object to represent the different alleles

Student Checklist


Chapter 14 Project

DNA Fields Forever

Project Goal + Timeline

In keeping with the old adage "Seeing is believing," this project will show you how to extract a crude preparation of DNA from an organism. This laboratory activity requires a few household items and will take approximately two hours to complete. There are also several recommended variations on this experiment that you can try (each roughly taking the same time as the first). You can try these variations in parallel with the first by scaling up the ingredients and splitting the material.

Directions

Part 1: Extract DNA!

While this procedure works to extract DNA from many types of organisms, the recommended organisms are strawberries. Strawberries have seven unique chromosomes, but instead of two copies of each chromosome, they have eight copies of each. (They are octoploid!) Make sure you have all the materials and equipment prepared before beginning your DNA extraction. Some substitutions can be made; you don't need a particular brand of dish detergent, for example, and you can use glass cups instead of plastic, if needed.

At the end of the procedure, there are several optional variations to try. You should at least consider what might happen if you tried these. If you want to attempt these additional experiments, you can start each from scratch, or you can scale up the amount of material you use; for example, if you use eight strawberries and a proportionally greater amount of extraction solution, you can then split up your filtrates into separate cups for the different treatments.

First, you should weigh two strawberries and record their mass. Ideally, this mass should be in grams, since the metric system is the standard convention for scientific experiments. (If you weigh in ounces or pounds, you should convert this measurement.) Record this data in Table 1. If you are performing one of the variations of the experiment, use two strawberries per experiment and make sure to record the mass of your additional strawberries.

TABLE 1: Mass of Strawberries
Experiment Mass of Strawberries (g)
DNA extraction (blank)
Optional variation: Digestive enzymes (blank)
Optional variation: Acid or base (blank)

To isolate the DNA, we need to release it from the cells in the strawberry. In the native tissue, the cells are protected by cellulose walls, and the DNA is surrounded by both a plasmid membrane and a double-layered nuclear envelope (both consisting of hydrophobic lipids).

Place the strawberries in a plastic bag, seal it, and then mash the strawberries. You should make sure that the strawberries are completely crushed. Crushing breaks up the tissues and cells, mechanically disrupting the cell walls and helping the cells break open to release their DNA.

While you allow the crushed strawberries to sit, prepare an extraction solution. In a plastic cup, combine ½ cup water, 1 teaspoon salt, and 2 teaspoons dishwashing soap, and mix thoroughly. Then, add about 2 tablespoons of this solution to the bag of strawberries. Reseal the bag and gently crush it again. Take care not to introduce too many soap bubbles.

  1. What was the purpose of adding the dishwashing soap to the strawberry mixture? How can soap help isolate or extract the DNA?

  2. Why did you need to avoid excessive soap bubbles or mechanical disruption when adding the detergent?

Place the coffee filter over the other plastic cup. Gently pour the solubilized strawberry extract through the filter. The resulting solution or fraction is known as the filtrate.

  1. What did you remove during the filtration step? What types of molecules do you have left in the filtrate?

Remove the coffee filter from the top of the plastic cup. Tilt the cup at an angle, and slowly pour approximately ½ cup of cold rubbing alcohol down the side of the cup so that it forms a layer on top of the filtrate. Place the cup back down and do not stir the solution. Watch for the development of a cloudy white substance in the top layer of this cup; that's the DNA precipitating!

  1. Rubbing alcohol (isopropanol) is a largely nonpolar molecule. Why do you think the addition of rubbing alcohol caused the DNA to precipitate? Why might salt have been necessary or important for this step?

Finally, you can remove the DNA from this precipitate by spooling it around a wooden stick, skewer, coffee stirrer, or toothpick. Remove the spooled material and place it on the wax paper, foil, or plastic. Allow it to air dry for a minute and then record the mass of this material in Table 2. Congratulations—you have just extracted a crude preparation of DNA!

TABLE 2: Mass of DNA
Experiment Mass of Precipitate (mg)
DNA extraction (blank)
Optional variation: Digestive enzymes (blank)
Optional variation: Acid or base (blank)
  1. What types of molecules would you expect to find in the precipitate? Why?

  2. Why was it important to spool the precipitate? What else might be in the precipitate that will not be collected by spooling?

Optional Variation: Adding digestive enzymes to the filtrate

In this variation, you will follow the previous instructions to produce the filtrate. Then, you will add (in powder form) 1 serving of a digestive enzyme to the filtrate. If your enzyme comes in tablet form, you should first crush it up into a powder. Mix gently and let the mix sit at room temperature for 5 to 15 minutes before proceeding to the precipitation step.

Optional Variation: Adding acid or base to the filtrate

In this variation, you will follow the previous instructions to produce the filtrate. Then, you will add 1 teaspoon of a strong household acid or base (but not both!) to the filtrate. Mix gently for 1 to 2 minutes, then proceed to the precipitation step. Note: You have now slightly increased the volume of the solution, so you will need to add slightly more rubbing alcohol compared to the instructions.

Part 2: Analyze and Review

  1. On average, there are approximately 4.0 × 10 9 grams of DNA per gram of strawberry. Multiply this value by the initial mass of strawberries recorded in Table 1 to find your expected DNA yield (the mass of DNA you could have expected to obtain from your strawberries). What was your expected DNA yield?

  2. Compare your expected DNA yield from Question 1 to your actual mass of DNA extracted from Table 2. Propose an explanation for any differences between these values.

  3. Now that you've isolated your DNA, imagine you wanted to determine the nucleotide sequence of a specific fragment. What technique could be used? How does this technique work?

  4. If you completed the optional extraction with digestive enzymes, what results did you observe? If you didn't complete this extraction, what effect do you predict the digestive enzymes would have had on the precipitate?

  5. If you completed the optional extraction with an acid or base, what results did you observe? If not, what would you predict to be different about the precipitate after treatment with acid? What about base? Why does changing the pH affect this procedure?

Project Materials

  • 2 tables for recording data

  • Pen or a pencil

  • Fresh or frozen strawberries (remove any green leaves)

  • A resealable plastic bag

  • Liquid dishwashing soap

  • Salt

  • Water

  • 2 plastic cups

  • 1 coffee filter

  • Cold rubbing alcohol (70% isopropanol)

  • 1 coffee stirrer, wooden stick, or toothpick

  • A balance or means of weighing material (together with a small piece of wax paper, plastic, or aluminum foil)

  • Optional: a meat tenderizer powder, bromelain, or digestive enzyme supplement (In all cases, these contain enzymes that digest proteins.)

  • Optional: household acid (lemon juice, vinegar) or base (ammonia)

Student Checklist


Chapter 15 Project

Let's Make a Movie!

Project Goal + Timeline

In this project, we will be reviewing your knowledge of protein synthesis and the relationship between genes and proteins by making a short movie. This project should be completed in groups of three to five within two to three hours.

Directions

Part 1: Make Your Movie

Make a short movie depicting protein synthesis in a eukaryotic cell. Here are the details.

  • Story: A cell teeters on the brink of death. If a protein doesn't get synthesized quickly, the cell and all the biomolecules within it dies. Can the cell be saved?

  • Cast: The characters are the biomolecules involved in transcription and translation. Cast members of your group to play these parts. The cast must include an RNA polymerase, a ribosome, and a tRNA molecule. Consider also having a dramatic narrator to narrate events as they occur.

  • Settings: Two settings, the nucleus and the cytoplasm, must be featured in your movie.

  • Props: Use props to represent molecules not played by the cast. At a minimum, you should include props to represent a DNA molecule, an mRNA transcript, and a polypeptide. These molecules should not be played by cast members. They should be items.

To get started, review all the details and requirements as a group. That includes the story, cast, settings, props, and requirements. Work together to choose members for each character in the cast. Next, determine how you will distinguish between the two settings, the nucleus and cytoplasm. A sign clearly stating the location is enough to satisfy this requirement. Locate or create items to serve as the props for DNA, mRNA, and a polypeptide. Select prop items that can be separated into smaller pieces to represent monomer units. Make labels for those props. Make signs for settings. Make nametags for all characters.

After reviewing the requirements, write or type a simple script and submit a copy to your instructor. The script doesn't need to be formatted in a particular way. However, it should list the cast assignments and include short scene descriptions, character entrances and exits, and character dialogue.

Try doing mini rehearsals while you're all working out the details of your script. When you're ready, start filming! You may choose to film using a phone or a computer. You can film all in one take, or film parts separately and use film editing software to combine them. Have fun and be creative!

Here are the requirements for your movie:

  • Transcription must be demonstrated in detail. You must show how the nucleotides in DNA are transcribed into the mRNA transcript. You do not need to explain every nucleotide, but at least once, a character or narrator should explain the relationship between the DNA and the new mRNA transcript.

  • Translation must be demonstrated in detail. For example, a character must identify a codon and demonstrate how that codon specifies a particular amino acid. You do not need to explain every codon, but at least one codon must be associated with the correct amino acid.

  • Identify all characters (RNA polymerase, ribosome, and tRNA) using nametags.

  • Label all props and settings.

  • Use props that can break down into smaller parts to represent the monomer units. For example, a string of connected paper balls can represent the polypeptide. Each paper ball would then represent an amino acid.

  • The film must convey what's happening. You may achieve this via a dramatic narrator, who narrates the action of the cast as it's happening, or you can have the cast talk to one another to show what they are doing. For example, perhaps the tRNA cast member speaks to the ribosome, "Hey bud, here's that methionine you needed."

  • The movie concludes when the ribosome finishes making the polypeptide.

One last thing! Here are you few things that your movie does not need to include. Your movie need not involve the Golgi apparatus or endoplasmic reticulum. You also do not need to depict any mRNA processing, such as intron removal or addition of a 5′ cap.

Part 2: Complete Prokaryotic Protein Synthesis Questions

Complete your project by answering the following questions regarding prokaryotic protein synthesis.

  1. Compare and contrast the steps in prokaryotic transcription with the steps in eukaryotic transcription.

  2. What is the role of the promoter in prokaryotic transcription?

  3. In prokaryotes, how might transcription be terminated?

Project Materials

  • Recording device (such as phone or computer)

  • Items for props

  • Large blank nametag stickers

  • Project questions

  • Pen or pencil

  • Blank paper

  • Optional: Film editing software

Student Checklist


Chapter 16 Project

It's Just an Expression

Project Goal + Timeline

In this project, you will be reviewing your knowledge of gene expression by making a poster about eukaryotic gene expression. This project should be completed by yourself or with a group within two to five hours.

Directions

Part 1: Make Your Poster

Make a poster describing eukaryotic gene expression by comparing two types of human cells. Use specific examples. For example, you could compare gene expression in a nerve cell to gene expression in a liver cell.

Here are guidelines for your poster:

  1. Compare and contrast the DNA sequences and gene expression of the two cell types. On your poster, present these cells as being from the same person, meaning their DNA sequences should be nearly identical. Emphasize that despite having identical DNA, these cells appear and function differently. Include images. These images can be hand drawn illustrations or computer images.

  2. Provide a specific example of how gene expression differs between these cells. Use the internet or other resources to identify an example of a gene expression difference between the two cell types.

  3. Highlight three mechanisms of regulation in eukaryotic gene expression. On your poster, show how these three mechanisms work. Use details and provide names of the important chemical participants. Show how these three mechanisms might allow your two cells with identical DNA to use their DNA differently. Choose three mechanisms from the following list. Use images as necessary to display these mechanisms.

    • chromatin remodeling

    • histone modification

    • DNA methylation

    • transcription factors

    • enhancers & repressors

    • RNA splicing

    • RNA stability

    • post-translational control of gene expression

Part 2: Complete Gene Expression Questions

Complete the following questions about gene expression.

  1. How can changes in gene expression disrupt the cell cycle? How might changes in gene expression lead to cancer?

  2. What are some ways that prokaryotic gene expression differs from eukaryotic gene expression?

Project Materials

  • 1 poster board

  • Drawing/art supplies

  • Glue and/or tape

  • Project questions

  • Pen or pencil

  • Computer with internet access

  • Optional: Printer for images

Student Checklist


Chapter 17 Project

GMOs, Yes or No?

Project Goal + Timeline

While the development of the technology to produce genetically modified organisms (GMOs) was a huge scientific achievement, application of those technologies to food production has not been without controversy. For all the "wins" of GMOs—such as the creation of desirable traits in crops, increased disease resistance, and improved nutritional value—their widespread commercial use has given rise to serious ethical and environmental concerns.

In this project, you'll expand upon what you've learned about applications of biotechnology by conducting a debate that explores the advantages and disadvantages of GMOs in agriculture. You'll pick a side (in support of or against GMOs), research and prepare your arguments, anticipate possible counterarguments, and draft your opening remarks. Then, you'll hold your debate in the presence of judges (your classmates). You should work in groups of four for this project, with two team members on the "in support" side and two on the "against" side. This project should be completed in two different phases. First, you will take time to prepare your arguments, and then you will have a debate in class. Teams may meet outside of class to work on their arguments.

Directions

Part 1: Research and Prepare

Work with your group to decide which pair of group members will debate in support of and which will speak against GMOs. Then, work with your partner to conduct some preliminary research to identify major arguments in support of and against the use of GMOs in agriculture. The arguments should address a variety of topics (such environmental impacts, economic impacts, etc.). Fill out Table 1 with the arguments you find.

TABLE 1: Arguments in Support of and against GMOs in Agriculture
Topic In Support Against
Human Health & Safety (blank) (blank)
Environment (blank) (blank)
Economics (blank) (blank)
Social Impacts (blank) (blank)

Now, dive deeper into your research. Find specific examples and evidence to support each argument that aligns with your position. For example, if you're arguing in support of GMOs, you'll find evidence to support each of the arguments in the "in support" column. Then, find examples and evidence to counter each of the arguments that is opposed to your position. You'll need this information so that you're prepared to rebut the opposing side's arguments.

Once you've conducted your research and are confident you've obtained information to support your own arguments and counter the opposition's arguments, prepare your opening statement. Your opening statement should last between two and four minutes and should persuasively present your main arguments.

Part 2: Have a Debate

Now that you've prepared, you're ready to initiate your debate. Meet with all four members of the group to agree upon the rules you will follow, such as no interruptions when one side is speaking and setting a time limit for each speaker. You should also agree upon the general structure for the debate. An example format is provided, but feel free to set your own.

  1. Side 1 presents their opening statement.

  2. Side 2 presents their opening statement.

  3. Side 1 provides more detailed information in favor of their position.

  4. Side 2 provides more detailed information in favor of their position.

  5. Sides take a short break to prepare rebuttals.

  6. Side 2 gives rebuttal.

  7. Side 1 gives rebuttal.

  8. Rapid discussion: sides alternate in making quick responses to specific arguments for a set duration of time

  9. Side 2 gives closing remarks.

  10. Side 1 gives closing remarks.

However you decide to structure your debate, make sure to include time for opening remarks, presentation of specific evidence and rebuttal arguments, and closing remarks.

Have other members of your class observe your debate and act as judges. Elect one of these judges to time speakers if you've agreed upon a time limit. During the debate, make sure to listen to the arguments presented by the other side and respond respectfully. After the debate, collect information from the judges to determine if one side was more persuasive than the other.

Project Materials

  • Pen or pencil

  • Computer with internet access

  • Timing device, such as a phone, stopwatch, or computer

Student Checklist


Chapter 18 Project

Molecular Evolution

Project Goal + Timeline

The goal of this project is to relate concepts of evolution in the context of organism lifestyle and appearance to evolution at the molecular level. You'll examine molecular evolution by comparing the amino acid sequences of a protein that is shared across species. This project should take between one and two hours of active time to complete. However, you may need to complete this project over two days to allow time for the software tools you'll be using to build alignments among amino acid sequences.

Directions

Part 1: Background and Predictions

The Ukrainian American geneticist Theodosius Dobzhansky once remarked, "Nothing in biology makes sense except in the light of evolution." This argument is reflected in this activity, during which you will apply the lessons you have learned about evolution at the species level to the molecular level. Moreover, the insights we can get by applying evolutionary thinking to molecular structures will shed light onto how these molecules work. Evolution by natural selection is the framework by which many disparate parts of biology and the life sciences can be understood.

This project can be done in two phases—first, by completing the assignment using preselected sequences, and then secondly, using sequences that you find on your own. The sequences in question will be the order of amino acids that make up a specific protein. Just as you might analyze the structure of beaks across birds or the evolution of other physiological traits in an organism, we can examine the exact structure of a single protein; all of these features can be selected for and relate to the fitness of the organism.

Without diving into too much biochemistry, it is important to understand what the sequences represent. Proteins are long chains of connected amino acids; there are 20 different types of amino acids that can be found at any given position in a protein. A particular combination of amino acids will fold into a specific shape with a unique chemistry, allowing the protein to carry out a specific activity in the cell. This activity may, in turn, influence the survival, appearance, or behavior of the organism.

A protein sequence can be represented by a string of single-letter abbreviations for each amino acid. For example, the sequence for the human lysozyme protein reveals that the first amino acids in the protein are M (methionine), K (lysine), and A (alanine). The sequence is shown in FASTA format, which is a text-based format for representing nucleotide and amino acid sequences in bioinformatics.

>AAC63078.1 lysozyme precursor [Homo sapiens]
MKALIVLGLALLSVTVQGKVFERCELARTLKRLGMDGYRGISLANWMCLAK-
WESGYNTRATNYNAGDRSTDYGIFQINSRYWCNDGKTPGAVNACHLSCSALLQD-
NIADAAACAKRVVRDPQGVRAWAAWRNRCQDRDVRQYVQGCGV

You will use a bioinformatics approach, together with evolution, to gain insights into this protein.

  1. Research what lysozyme is and how it works. What selective pressures do you think caused this enzyme to evolve in humans or a progenitor species?

  2. What other organisms might you expect to have an enzyme like this? Why?

  3. Which organisms do you think will have lysozyme sequences most like that of humans? Why?

Part 2: Sequence Search

Now you will search for an equivalent or similar sequence from different organisms—at least four additional sequences. You can do this in a few different ways:

  1. Use the NCBI Protein Database. In the search bar at the top of the page, search both the name of the enzyme and a species name (if needed, species names are provided in the Project Materials section). Select a relevant result, and on the page describing the result, select "FASTA" to access the complete amino acid sequence in FASTA format.

  2. Use the NCBI protein BLAST tool. Enter the amino acid sequence for the human lysozyme protein in the box for Step 2, then submit your job. When the results are ready, select sequences from different organisms to investigate.

Make sure to copy the FASTA sequence from your result into Question 3.

  1. What are the sequences of lysozyme from other organisms—such as cow (Bos taurus) or chicken (Gallus gallus)? How do they compare to the sequence from humans?

Part 3: Align and Analyze

Now, you can examine the differences in a more systematic and informative way using a combination of the tools Clustal Omega and Mview. The first tool will identify the conserved sequences (similar sequences that suggest shared ancestry) in each protein, while the second will allow you to compare these sequences. Note: if you have collected the other sequences by running an NCBI BLAST+, you can simply 'launch' the Clustal Omega and Mview tools from the main results window by selecting that option in the dropdown box on the left.

Input your sequences into Clustal Omega and run the program. This program will show which sequences best align. Note: this program may take several hours to run. Return to your project once the results have been compiled.

Once the alignments have been completed, explore the output in Clustal Omega. Then, go to the "Results Viewer" tab, and select "view in Mview" near the bottom of the page. Submit your job in Mview. The Mview output highlights the shared amino acids at each position in the conserved sequences and calculates potential consensus sequences. The consensus sequence gives the most common amino acid at each position in the conserved sequences.

  1. Are there any conserved sequences in the lysozyme protein across the species you selected? What sequences are similar, and how similar do these sequences appear to be?

  2. Why do you think some sequences are conserved or the same across all species? How can you explain this result using evolution by natural selection?

  3. What does the information you found tell you about the protein? What might you do with this information?

Part 4: Further Exploration

Now it's your turn to be creative! Repeat all the above steps, but with a protein other than lysozyme. Answer the same questions, but with a protein that you or a partner has picked.

Project Materials

  • Project worksheet and a pen

  • Computer with internet access

  • Access to bioinformatics websites:

  • Organism names and Taxonomic IDs. Possibilities include Homo sapiens (human, 9606), Bos taurus (cow, 9913); Gallus gallus (chicken, 9031); Pan troglodytes (chimpanzee, 9598); Danio rerio (zebra fish, 7955); Mus musculus (mouse, 10090); Rattus norvegicus (rat, 10116); Xenopus laevis (African clawed frog, 8355); Arabidopsis thaliana (thale cress, 3702); Caenorhabditis elegans (roundworm, 6239); Drosophila melanogaster (fruit fly, 7227). Others can be found through NCBI's taxonomy browser.

Student Checklist


Chapter 19 Project

Rolling the Dice for Evolution

Project Goal + Timeline

In this project, you will apply your knowledge of evolution and changes to gene frequencies. The goal will be to directly observe, via simulation, the different ways in which a population can evolve. This project should be completed by yourself or within a group in a two-hour time frame and will require either a set of 10 dice or a dice simulation like the one found on this website.

The project will simulate the evolution of different pigmentation traits in the peppered moth (Biston betularia). Before the 1700s, the white-bodied phenotype and associated alleles were most frequent in this species in England because it provided effective camouflage against the light-colored bark of the region's trees. However, with the advent of the Industrial Revolution and pollution from burning of fossil fuels, soot accumulated on the trees. This inverted the selection for pigmentation in the moth; now, black-bodied moths were more fit for the environment, and white-bodied moths became easier prey for predator species to see. The frequency of the allele changed accordingly, demonstrating the most classic example of evolution. To learn more about the history of the peppered moth, check out this video.

Directions

In this project, you will simulate the evolution of melanism, or dark pigmentation, in the peppered moth (Biston betularia). The way the white- or black-bodied alleles changed in frequency during the Industrial Revolution is a classic example of natural selection. In this project, we will suppose that the black-bodied allele (B) is dominant, and the white-bodied allele (b) is recessive.

Part 1: Genetic Drift and Bottleneck Effect

First, let's imagine that you are studying these moths in a series of small islands in the North Atlantic. We will start our observations on an island that has an equal distribution of black- and white-bodied individuals: 25 of each.

  1. Using the Hardy-Weinberg equation, calculate the frequency of each genotype and predict how many black- and white-bodied individuals you should observe in the next generation. Record this in the appropriate rows in the first column of Table 1.

  2. You will then simulate genetic drift by allowing some of these moths to survive and mate at random. First, simulate survival of some moths and deaths of the others. Roll 10 dice; for each even number, remove a white moth from the population, and for each odd number, removed a black moth from the population. You should record what the result of your dice roll is in the next two rows on Table 1.

  3. Using these 40 survivors, build the population back to 50 moths. You can do this by once again use the Hardy-Weinberg equation. Using the proportion of white moths (bb), you can find the frequency of each allele, and then predict how many of each genotype (and phenotype) you should see. If you obtain a fraction in your answer, you should round to the nearest integer and ensure that you have 50 moths total. Record the new frequencies in the bottom two rows of the table. Write this total in the starting population rows for the next column.

  4. Repeat the preceding steps again, simulating another round of genetic drift. Note that the frequencies at the bottom of the column for generation 1 are effectively repeated in the middle rows of column 2.

  5. For the third round, we will suppose that a small amount of these moths has left to populate a nearby island. This is a simulation of the bottleneck effect on genetic drift. This time, you will throw 10 dice, but this will represent the founding moths of a new population. (Even still represents white, and odd still represents black.)

  6. Reconstitute the population as before; calculate the frequency in this founding population and use it to bring the total up to 50. (If it helps, you can imagine this as the carrying capacity of the environment in this project.)

  7. For the fourth and final generation, you can repeat steps 2 and 3.

TABLE 1
Generation 1 2 3 4
Starting White 25 (blank) (blank) (blank)
Starting Black 25 (blank) (blank) (blank)
(B) Allele Frequency (blank) (blank) (blank) (blank)
(b) Allele Frequency (blank) (blank) (blank) (blank)
White Removed (Remaining) (blank) (blank) Survivors:(blank) (blank)
Black Removed (Remaining) (blank) (blank) Survivors:(blank) (blank)
(B) Remaining Allele Frequency (blank) (blank) (blank) (blank)
(b) Remaining Allele Frequency (blank) (blank) (blank) (blank)

Answer the following questions:

  1. According to the Hardy-Weinberg equation, did evolution occur across any of the generations?

  2. Did the frequency of alleles in the population change in a particular direction each generation, or did it drift randomly?

  3. Did the frequency of alleles in the population change more significantly after the bottleneck effect? How does this impact the evolution of this species?

  4. In the final generation, what proportion of each genotype do you expect to find?

Part 2: Natural Selection

Now, we will suppose that the moths have colonized an island in which there is a predator that can more easily pick out the white-bodied individuals against a darker background environment. This mimics what was observed during the Industrial Revolution, in which pollution darkened tree bark and made it harder for predators to identify the black-bodied individuals.

Here, you will simulate survival like before, except we now expect black-bodied individuals to have a better chance of survival and a lower chance of predation. Starting from the same population of 25 moths of each type, roll 10 dice and determine which moths were eliminated. Here, a roll of 1–5 will represent a white moth, while a roll of 6 will represent a black moth.

  1. Using the Hardy-Weinberg equation, calculate the frequency of each genotype and predict how many black- and white-bodied individuals you should observe in the next generation.

  2. You will then simulate natural selection by allowing some of these moths to survive, but in a way that favors one phenotype over another. Here, you will simulate predation of these moths in which the black-bodied individuals have better camouflage and, therefore, are harder for a predator to find. Roll 10 dice; for each time you roll a 6, remove a black moth from the population, and for each time you roll any other number, remove a white moth from the population.

  3. Using these 40 survivors, build the population back to 50 moths. You can do this by once again use the Hardy-Weinberg equation. Using the proportion of white moths (bb), you can find the frequency of each allele and then predict how many of each genotype (and phenotype) you should see. If you obtain a fraction in your answer, you should round to the nearest integer and ensure that you have 50 moths total. Write this total in the starting population rows in column 2 of Table 2.

  4. Repeat the preceding steps again for generations 2, 3, and 4, simulating several rounds of natural selection.

TABLE 2
Generation 1 2 3 4
Starting White 25 (blank) (blank) (blank)
Starting Black 25 (blank) (blank) (blank)
(B) Allele Frequency (blank) (blank) (blank) (blank)
(b) Allele Frequency (blank) (blank) (blank) (blank)
White Removed (Remaining) (blank) (blank) (blank) (blank)
Black Removed (Remaining) (blank) (blank) (blank) (blank)
(B) Remaining Allele Frequency (blank) (blank) (blank) (blank)
(b) Remaining Allele Frequency (blank) (blank) (blank) (blank)

Answer the following questions:

  1. According to the Hardy-Weinberg equation, did evolution occur across any of the generations?

  2. Did the frequency of alleles in the population change in a particular direction each generation, or did it drift randomly?

  3. In the context of the theory of evolution by natural selection, does your result make sense?

Part 3: Comparison

As a way of contrasting the random nature of genetic drift with the nonrandom evolution of an adaptation by natural selection, you should compare your previous results with a friend that also completed both exercises. Alternatively, you can repeat the exercise from scratch.

  1. Did your results match that of your friend's (or your repeat attempt) for Table 1? In what ways were they different, if at all?

  2. Did your results match that of your friend's (or your repeat attempt) for Table 2? In what ways were they different, if at all?

  3. Why might your answers for the previous two questions differ? Why might you expect similar results when comparing to a friend for the natural selection exercise but not the genetic drift exercise?

Project Materials

  • 2 tables for recording data

  • Pen or pencil

  • 10 physical dice, rerolling of a smaller number of physical dice, or a dice-rolling simulator

Student Checklist


Chapter 20 Project

Planting Phylogenetic Trees

Project Goal + Timeline

In this project, you will explore how phylogenetic trees are made using protein sequence data. In fact, you will compare this method against your intuitive understanding of evolutionary relationships and trees based on physical appearance and physiology of the organisms. Creating these trees and establishing these relationships can be important for better understanding how different parts of an organism work. This project should take between one and two hours to complete.

Directions

Part 1: Background and Predictions

As organisms evolve, they change in many ways—for example, in appearance, physiology, and behavior. Underlying all of these are changes at the genetic level to the sequence in DNA and the corresponding sequence of amino acids in proteins encoded for by the DNA. One way in which scientists can establish evolutionary relationships and build phylogenetic trees is by examining these sequence differences among organisms.

For this project, you will need to collect protein sequences from a variety of organisms. Well-known organisms are great choices, especially those that are used frequently in experiments, are of importance to society, or are otherwise well studied. These include our own species, Homo sapiens, as well as the chimpanzee, cow, or chicken (see the Project Materials section for an expanded list). You can find the FASTA format protein sequences by searching for them in the NCBI Protein Database, among other sites.

  1. Decide what set of at least five species you will compare. Based on existing phylogenetic trees or your own intuitive understanding, predict what the evolutionary relationships are among these organisms. What is the rationale for your prediction?

  2. Draw a cladogram to represent your hypothesized relationships among the organisms.

Next, you will collect sequences for the same protein from each organism you've selected. You can pick a variety of different proteins—from ones that might be specific to an organism's metabolism (such as insulin), to defense proteins in multicellular organisms (such as lysozyme), to something that might be universal to all cells (such as EF-Tu, a translation factor found in all cells).

  1. Decide which protein you'd like to analyze. You may find it helpful to do a search for some proteins that are common across a particular group of animals. Give the name of your protein and describe its function.

Part 2: Sequence Search

You'll collect the amino acid sequences in the FASTA format. In FASTA format, the sequence of amino acids in a protein is represented using a one-letter abbreviation for each of the twenty possible amino acids at each position in the protein. The specific combination observed gives the protein a unique structure and chemistry, endowing it with a particular ability in the cell.

Collect the sequences by searching in the NCBI Protein database. In the search bar at the top of the page, search both the name of the protein and a species name. Select a relevant result, and on the page describing the result, select "FASTA" to access the complete amino acid sequence in FASTA format.

  1. What are the sequences of this protein from at least five different organisms?

Part 3: Tree Construction

Once you have the sequences collected, you can use it to create a phylogenetic tree using the Phylogeny.fr tool. Select the "one click" version of the tool and input all your sequences in FASTA format.

  1. What are the evolutionary relationships evident from this analysis? Provide the phylogram, cladogram, or tree generated by the software.

  2. Explore different types of representations. Which is most informative for this particular analysis?

  3. How does this tree compare to the one that you created before the analysis? What are some possible reasons for any discrepancies?

Part 4: Further Exploration

Now you should expand on your analysis. You can do this by repeating the bioinformatics analysis but using a different target protein. You can also increase the number species you are examining.

  1. When selecting another protein to carry out the comparison, does this change your answer to the questions in Part 3? Provide the new phylogenetic tree and any new conclusions.

  2. What type of gene or protein do you think is most useful for making comparisons over a long evolutionary timescale?

Project Materials

  • Project worksheet and a pen, or a computer with a word processor

  • Access to bioinformatics websites:

  • Organism names and Taxonomic IDs for Homo sapiens (human, 9606), Bos taurus (cow, 9913); Gallus gallus (chicken, 9031); Pan troglodytes (chimpanzee, 9598); Danio rerio (zebra fish, 7955); Mus musculus (mouse, 10090); Rattus norvegicus (rat, 10116); Xenopus laevis (African clawed frog, 8355); Arabidopsis thaliana (thale cress, 3702); Caenorhabditis elegans (roundworm, 6239); Drosophila melanogaster (fruit fly, 7227). Others can be found through NCBI's taxonomy browser.

Student Checklist


Chapter 21 Project

The Viral Podcast

Project Goal + Timeline

In this project, we will be reviewing your knowledge on viruses through a podcast presentation. The podcast should last 30 minutes. This project should be completed within a group of two to four students in approximately three hours.

Directions

Part 1: Plan Your Podcast

You'll want your podcast to touch upon the following topics:

  • a clear definition of what a virus is, including what it is composed of and why it is considered distinct from living organisms

  • an explanation of how viruses were discovered and detected

  • an explanation of how viruses interact with their hosts, including how they replicate

  • an explanation of the differences between a DNA and RNA virus

  • an exploration of the prevention and treatment of viral infections

Start brainstorming how you'd like to develop these topics—as a general presentation of information or through a discussion of a particular virus? Feel free to be creative! In the brainstorming process, make sure to develop a theme for your podcast. Ideas include developing the podcast as if giving a lecture or holding a class, conducting an interview, conducting a trivia or quiz-style game show, or solving a real-world mystery. You may choose to invite guests to speak on your podcast, or you may wish to consult subject matter experts to bring authority to the topics you cover.

After you've determined your theme and topics, develop a name for your podcast. A strong title will help your episode stand out and will attract the right audience. Then, write a brief sentence as the tagline to your episode. You'll want to grip and intrigue your listeners with your tagline, so make sure to plot your words out carefully. You may wish to add music to your podcast. If so, define the musical theme for your episode.

Part 2: Write Your Podcast

Write or sketch out your plan for you podcast. You can follow along with the given general structure or develop your own structure.

  1. Opening: Provide a quick musical jingle or a voiceover announcing the title of your podcast.

  2. Introduction: Give a brief monologue-style introduction outlining your hosts, guests (if any), and what you plan to talk about or do on your show.

  3. Transition: A transition may use music, podcast sound effects, or a vocal announcement, such as "We are going to move on and talk about…" or "In other news this week…"

  4. Topic 1: How you develop your topic(s) will depend on your theme. For example, if you are hosting a quiz show, the first segment in your podcast may be questions on your first topic. If you are presenting a lecture, your lecture will discuss the first topic.

  5. Transition

  6. Topic 2

  7. Transition

  8. Topic 3

  9. Transition

  10. Topic 4

  11. Closing remarks: Thank your listeners and your guests.

  12. Closing musical jingle

After scripting, make sure you have the equipment you need to record your podcast. You can use the recording option from your phone or computer. Now, it's time to record!

Part 3: Record Your Podcast

Using the script you've prepared, record your podcast with your classmates, following your intended theme. You may choose to record the entire podcast all at once or record different components of the podcast and combine them using audio editing software. After recording, make sure to share your podcast with your classmates and check out the ones they've prepared!

Project Materials

  • Audio recorder

  • Computer

  • Optional: microphone

Student Checklist


Chapter 22 Project

Scientific Poster: Prokaryotes

Project Goal + Timeline

In this project, we will be reviewing your knowledge of prokaryotes by creating a poster presentation focused on a specific topic related to prokaryotes. After creating your poster, you'll prepare a short presentation and attend a session to talk with interested students and teachers. This project should be completed within a group of two to four students in a two-hour time frame.

Directions

Part 1: Plan Your Poster

To help with planning, review the topics you've learned throughout the chapter and pick an area of focus. Maybe you'd like to explore the evolution of prokaryotes and how they've changed the Earth throughout its history, the diversity of prokaryotes and their adaptations to extreme environments, or the role of prokaryotes in public or ecosystem health. Pick a topic that interests you!

The poster you create should be a succinct, clear, and self-explanatory presentation that focuses on a topic. Include a section that introduces your topic. Then, include three to five brief sections that explore or explain subtopics of your general topic. Your poster should present this information in a concise and visual way, so make sure to include figures and images to communicate your central ideas. Check out the example poster structure in Part 4 for one way to structure a poster.

As you plan out your poster, make sure to complete the following:

  • Determine the message that you want to communicate with your audience.

  • Determine a rough outline of the text and figures on your poster.

  • Decide your method for building your poster. You may choose to print out the text and images and paste them onto posterboard. Alternatively, you may develop your poster in a presentation software and then print it out.

Part 2: Create Your Poster

First, prepare the text. Write the text of your poster in a word processing software before printing or copying it to a poster design software. Make sure to write a title that succinctly describes the subject and conclusion of the poster. Then, develop a background/introduction that provides just enough information for another student to understand your topic. Whenever possible, use diagrams to communicate information visually. Also, include several summary sections. Ideally, each section will be composed of a title, text, a figure, and a brief figure legend. Reduce text as much as possible to make your poster more approachable and clear. If you consult any outside resources, prepare a reference list.

Then, prepare the figures you'll include in your poster. Make sure your figures have a clear connection to the content and are being used to either illustrate or further explain the ideas conveyed on your poster. You may choose to prepare any specialized figures in a graphing software or illustration software. If you use any figures from the internet, make sure to include a citation for the image. Make sure to design your figures so that they can be read from at least two feet away.

Now, you're ready to prepare the layout.

  • Ensure that your poster is the correct size (48 inches wide x 36 inches tall).

  • Choose a foreground color, background color, font, and font sizes that enhance clarity and visibility. At least a 16 pt. type for most fonts is recommended for the smallest text sections.

  • Make sure the title is written in a larger font size so that it is clearly visible. Add your name and the names of your group members directly beneath the title in a smaller font size.

  • Make sure all figures have a brief explanatory caption and a citation, if needed.

  • Ensure that your poster is completely free of errors, typos, and grammatical mistakes.

Part 3: Present Your Poster

Prepare and rehearse a short, three-to-five-minute oral presentation. Your presentation should start with a hook—some gripping information that will pique a listener's interest. Then, you should take the listener through your poster, explaining each section. Do not get bogged down in the details, but rather focus on the big picture and major takeaways. Listeners who want to know more can always read the text!

When you present your poster, be available to take interested listeners through your topic, but also make sure you find the time to walk around, view other students' posters, and listen to their presentations.

Part 4: Example Poster

Poster Title: Prokaryotes, the Founding Inhabitants of Earth

Introduction: Introduce the early history of prokaryotes and their role very early in Earth's existence (oxygenation of the atmosphere). Include an image of cyanobacteria. Explain that prokaryotes have played a critical role in the evolution and maintenance of life on Earth.

Poster Sections

  1. The Prokaryotic Cell: Discuss prokaryotic structure and include a diagram of a prokaryotic cell.

  2. Prokaryotic Evolution: Discuss relationships among bacteria, archaea, and eukaryotes. Add an image of the three domains of living organisms.

  3. Prokaryotic Metabolism: Describe different ways prokaryotes metabolize and draw connections to the impact of prokaryotic metabolism on Earth's processes throughout geologic history. Include a figure showing carbon and energy sources in prokaryotes.

  4. Role of Prokaryotes in Ecosystems: Discuss contributions of prokaryotes to contemporary ecosystems. Include a figure of the roles of prokaryotes in carbon and nitrogen cycles.

Conclusion: Summarize the information on poster and relate back to the introduction, emphasizing the impact of prokaryotes in making the Earth habitable.

Project Materials

  • Poster board or poster creation software

  • Computer

  • Printer

Student Checklist


Chapter 23 Project

Peeping at Protists

Project Goal + Timeline

In this project, we will be reviewing your knowledge of protists by using a microscope to observe protists and their behaviors. You'll try to apply your knowledge of protists to classify the organisms you find. This project should be completed within a group of two students in a two-hour time frame.

Directions

Part 1: Check Out Some Protists

You'll use a microscope to observe and identify protists from a sample of water. First, prepare a wet mount using a drop of pond water. To prepare a wet mount, use a pipette to drop a small sample of the water on a glass microscope slide, then gently place the coverslip on top of the water. Use a paper towel to wipe up any excess. Check your wet mount for any bubbles. A large bubble will obstruct your view of any microorganisms. If you do see a large bubble, try making the mount again with a smaller drop of water.

Place your wet mount in the microscope stage. Use the 10X objective to search for any living, moving organisms. Once you've found one, proceed to the 40X objective and focus on the organisms. Try to dim the light or use minimal light when viewing these small organisms. The excess heat created by the light bulb may injure these tiny creatures.

Record your observations in Table 1. Draw each of the organisms and note any specialized structural features. Describe the movement of the organism. Try to discern if you see ciliates (protozoans with fine hairs) or flagellates (protozoans with a whiplike tail). Attempt to identify each organism using the information from Chapter 23.

Organism 1 Organism 2 Organism 3
Drawing (blank) (blank) (blank)
Special Structures (blank) (blank) (blank)
Movement Pattern (blank) (blank) (blank)
Ciliate or Flagellate (blank) (blank) (blank)
Potential Identification (blank) (blank) (blank)

Part 2: Review Questions

  1. Why are protists difficult to classify?

  2. Consider the identifications you made of the protists you observed. What supergroup does each of your protists belong to? What are some of the key characteristics of each of these supergroups?

  3. Name and describe three structures protists may use for movement. How are these structures similar? How are they different?

  4. The endosymbiotic theory helps explain the origin of the first eukaryotic cells (protists). What does this theory propose? What evidence is there in support of this theory?

  5. What functions do the two kinds of nuclei within Paramecium perform?

  6. Describe how the parasite Plasmodium causes disease in humans.

Project Materials

  • Pen or pencil

  • Pond water

  • Microscope slides

  • Coverslips

  • Light microscope

  • Project table and questions

Student Checklist


Chapter 24 Project

Draw a Fungal Jungle

Project Goal + Timeline

In this project, we will be reviewing your knowledge of the kingdom Fungi by creating a poster depicting a mushroom's role in its ecosystem. This project should be completed by yourself or with a group.

Directions

Part 1: Mushroom Ecosystem Poster

To start, choose a mushroom species and at least two other organisms, such as insects, plants, or animals, to make up your ecosystem. Select species for which you can easily explain their ecological relationships to the mushroom.

For your poster's images, you must make them yourself. Either (a) draw the images or (b) create the images yourself using a computer program.

Develop a two-color label system using your colored paper. Make labels as instructed and then attach them to the poster. Color #1 will be for names, such as species and the terms of anatomical structures. Color #2 will be for adding explanations and details and answering specific questions. For reference, write those colors in the table.

Color #1 (Use for Names) Color #2 (Use for Explanations)

Instructions for your ecosystem's mushroom:

  • Choose a specific mushroom species. You cannot choose generic mushrooms.

  • Include the following structures: mycelium, thallus, hyphae, and spores.

  • Include any structures that allow for the mushroom's reproduction.

  • Using label color #1, label your mushroom figure with the common and scientific names and indicate its phylum. Then, label the mycelium, thallus, hyphae, spores, and reproductive structures.

  • Using color #2, indicate three features characteristic of the kingdom Fungi on your mushroom. Then indicate one feature characteristic of this mushroom's phylum.

  • Using color #2, create a second label for the mycelium. This label should detail the mycelium's composition and explain the mycelium's role in the mushroom's mode of nutrition.

  • Using label color #2, create a label to indicate and explain the mushroom's mode of reproduction.

Instructions for the rest of your ecosystem:

  • Your model must include at least two other life forms to make up a simple ecosystem. These two organisms can be any type of life form—plant, microbe, animal, or otherwise.

  • Feel free to depict these two organisms as living or dead, whichever is more relevant to their relationship with the mushroom.

  • Using label color #1, specify both species' common and scientific names.

  • Using color #2, explain the ecological relationship between each species and the mushroom. Use arrows to reinforce these relationships. The ecological connection can be either (a) specific to this exact species or (b) a nonspecific link (such as a general decomposition relationship). However, the indicated relationship must be different for the two species.

  • Complete your ecosystem's landscape. Depict grass, sand, or other backgrounds to complete the terrain. The finished product should be an entire landscape, not just a simple picture of a mushroom and two life forms.

Part 2: Review Questions

Complete this project by answering the following critical thinking questions.

  1. List the five fungi phyla and describe each in terms of a major representative species.

  2. What is one example of fungi's implications on agriculture?

  3. What is one example of fungi's implications on pharmaceuticals?

Project Materials

  • 1 poster board

  • Drawing supplies

  • Glue and/or tape

  • Paper in two colors (for labels)

  • Pen

Student Checklist


Chapter 25 Project

The Seedless Garden

Project Goal + Timeline

In this project, we will be reviewing your knowledge of seedless plants and the evolution of seedless plants by making a book. This project should be completed alone or in groups of two over a week.

Directions

Write either (a) a children's book or (b) a coffee table book. Your book must be about seedless plants' and water plants' challenges when adapting to life on land. Present your book as a story of overcoming these challenges by moving from the most primitive seedless plants to the more modern and complex.

Structure your story into four sections.

Three sections should focus, in turn, on three representatives of the following groups: liverworts, hornworts, and mosses. For each group, share the distinguishing characteristics. Then share with your reader how the group has adapted to life on land and identify any new traits that first appeared in this group.

Your story does not have to be overly academic. Especially if you choose the children's book option, you are encouraged to develop a story with characters.

A fourth section should focus on seedless plant life cycles. Choose one of the following groups: club mosses, horsetails, whisk ferns, or true ferns.

Here are the technical requirements:

  • You must have at least six pictures. Draw illustrations or, if you prefer, take photos. But if you use photos, ensure that you take at least half of the pictures yourself. The other half, if you want, can come from internet sources. (Make sure to cite these.)

  • The total word count of your book should be between 500 and 800 words.

  • Your book must have a cover with a title, word count, and author's name. Any cover images count toward your required six pictures.

  • Each page should be numbered at the bottom right.

  • Your book much be assembled into three-ring binder.

To create the physical book, make each page a separate sheet of paper. Don't forget the cover. Then compile these pages into a three-ring binder.

Project Materials

  • A three-ring binder

  • Three-hole punch

  • Blank paper

  • Art supplies (markers, colored pencils, pens, etc.)

  • A pen

  • Glue/tape

  • Optional: camera and printer

Student Checklist


Chapter 26 Project

David Attenborough Not Included

Project Goal + Timeline

In this project, we will be reviewing your knowledge of seed plants and seed plant diversity by making a nature documentary about the seed plants in your community. This project should be completed by yourself or within a group over a week.

Directions

Part 1: Seed Plant Documentary

Make a nature documentary about the seed plants in your community. You are this film's director, producer, narrator, and photographer. Choose your video style. Also, choose how you present all visual elements. You can use photographs, video, or a combination of both.

For example, you could take a walking tour through a vegetated area as you narrate what you see. Alternatively, you could create your documentary in a video program from only photos, and add an audio overlay. Your video must be narrated in your own words, either speaking directly or using a text-to-speech program.

Structure your video with an introduction, a middle, and a conclusion. In other words, avoid making a video that simply answers the required documentary components. These components must be presented in a thoughtful, documentary-style product.

  1. Begin your video with a documentary-style introduction that invites the viewer to watch your documentary. Your introduction should summarize the purpose of the documentary and give the viewer a taste of what's to come. It may be helpful to watch the first minute or so of your favorite documentaries to get some ideas.

  2. Fill up the middle of the documentary with these components:

    • Obtain footage (video or photos) of seed plants in your community that represent both gymnosperms and angiosperms.

    • Explain when seed plants first appeared and when gymnosperms became the dominant plant group.

    • Using your footage, explain the major innovations of seed plants.

    • Using your footage, explain the purpose of pollen grains and how they differ from seeds.

    • For gymnosperms, list the four groups and indicate which group the plants in your footage represent.

    • For gymnosperms, explain the function of the cone.

    • For angiosperms, compare and contrast the two main groups of flowering plants.

    • For angiosperms, detail the life cycle of a typical angiosperm.

  3. Conclude your video with a documentary-style conclusion. Restate the purpose and finish with a thoughtful video sign-off.

Here are the technical requirements for your documentary:

  • The video must have a title.

  • The video duration should be between 7 and 10 minutes, including the introduction and the conclusion.

  • The video must be narrated in your own words.

  • All images in this project must be your own. You may not use stock video or images.

  • Your film's photos and/or video should be relevant to the content.

Part 2: Review Questions

Finish this project by writing answers to the following questions about flowers.

  1. Describe the two main types of flowering plants.

  2. List five main parts of a flower and explain the role of each.

  3. Describe one specific example of a pollination method.

Project Materials

  • Video recording device

  • Question set about flowers

  • Pen/pencil

  • Optional: Video editing program

Student Checklist


Chapter 27 Project

Draw a Tree of Animal Life

Project Goal + Timeline

In this project, we will be reviewing your knowledge of animal diversity by creating a poster of a phylogenetic tree depicting animal diversity. This project should be completed by yourself or in a group within two hours.

Directions

Part 1: Create a Phylogenetic Tree

Create a poster of a phylogenetic tree depicting animal diversity.

Include the following modern animal groups: Arthropoda, Nematoda, Platyhelminthes, Rotifera, Ectoprocta, Brachiopoda, Annelida, Mollusca, Chordata, Echinodermata, Acoela, Cnidaria, Placozoa, Porifera, and Ctenophora. For each modern animal group, add one representative species to that group. Then, add a picture of each representative species. These pictures can be your drawings or internet images. Make sure to cite any internet images.

Also include the following phylogenetic branches, or divergences: Ecdysozoa, Protostomia, Deuterostomia, Lophotrochozoa, Acoelomates, Bilateria, Eumetazoa, Parazoa, Metazoa, and Radiata. For each branch, include a statement answering the following question: "What changed?" Then, briefly explain the new defining characteristics.

Part 2: Use Your Phylogenetic Tree to Answer Questions

Answer the following five questions on a separate piece of paper. Then, cut those out and glue them to the poster. Number each answer 1 through 5, one for each question listed.

But wait, there's more! For full credit, you must do more than write the answers. Use your phylogenetic tree to show your answers. Draw arrows to associate each answer to relevant examples in your tree.

For example, when question #4 asks for animal groups that arise from the Cambrian explosion, do not simply list those animal groups. Instead, draw arrows on your poster pointing out those groups, and then mention them in your answer.

Here are the five questions:

  1. How do animal body plans differ and how do these body plans support animal classification?

  2. Show the features that characterized the earliest animals and approximately when they appeared.

  3. What was the Cambrian explosion and when did it occur?

  4. Which animal groups arose after the Cambrian explosion?

  5. List the mass extinction events. Choose one of them and include details explaining how the event affected the outcome of evolutionary history and animal diversity.

Part 3: Complete Review Questions

Conclude this project by answering the following questions.

  1. What features distinguish kingdom Animalia from other kingdoms?

  2. What types of data do scientists use to determine phylogenetic trees?

Project Materials

  • Poster board

  • Drawing materials (markers, pens, etc.)

  • Blank paper

  • Pair of scissors

  • Tape and/or glue

  • Optional: Computer with internet access and printer for images

Student Checklist


Chapter 28 Project

Interview with an Invertebrate

Project Goal + Timeline

In this project, we will be reviewing your knowledge of invertebrates by role-playing interviews with six invertebrate characters and recording them as a podcast series. Work in groups of two to four.

Directions

Role-play and record six short podcast interviews, each 3 to 5 minutes long. This podcast will require group members to role-play interviews with six different invertebrates from the same marine coral reef community.

For each interview, one group member will role-play as an invertebrate from a marine coral community. Another member will role-play as the podcast host. Prepare for these podcasts with these steps:

Step 1. Work together to create an invertebrate character from each of the following categories. For each category, pick a representative species. Then, create a character for each, giving each character a unique name. The categories are:

  • Sponges

  • Corals, jellyfish, or sea anemones

  • Flatworms, nemerteans, or rotifers

  • Mollusks or annelids

  • Nematodes or tardigrades

  • Arthropods

Step 2. Next, work together to create a host character. The host can be any species you want and should have a name. If the role of the host is to be alternated from one episode to another, then every group member can make their own host character.

Step 3. Plan and record your interviews using the following guidelines:

  1. The host should begin each episode with a brief introduction statement, such as "Hi, I'm (blank), your host this evening for Episode 1 of Interview a Coral Community Member."

  2. Then, the host should introduce the character. First, state the character's species and fictional name. Then, the podcast host should briefly describe the interviewee's unique anatomical and morphological features. (Basically, explain what the character looks like.)

  3. Then, the podcast host should ask the character to introduce themself by explaining which invertebrate phylum they belong to and ask them to state some identifying characteristics of this phylum.

  4. Finally, the host should ask each character one of the interview questions in the following list. Plan these questions in advance of the interview. The point of this project is not to surprise group members with random questions; the point is to pick questions that best represent this species. The entire group is responsible for the answers, not just the actor.

Choose one question for each interviewee from the following list:

  • In what different body forms might your family members appear?

  • What challenges do you face on a day-to-day basis?

  • What does it mean to you to be a parasite, and in what ways do you feel like parasites are misunderstood?

  • What are some of the advantages of your body plan?

  • What are the advantages of true body segmentation?

  • How are members of your species used in research, and how do you feel about that fact?

  • What is an essential extracoelomic cavity you have, and how do you use it?

  • Why do some community members call you the "simplest life form"? How do you feel about that distinction?

  • Explain the steps of tissue development experienced by you and your family.

The following are the technical requirements for your project:

  • The total airtime for combined interviews should be between 20 and 30 minutes (approximately 3 to 5 minutes per interview).

  • Give your podcast a unique title and introduce each episode with that title and episode number.

  • All members of the group should participate in the role-play aspect. In other words, make sure it's not the same two people being interviewed each episode (unless your group only has two people).

  • When choosing from the list of questions, use questions only once. Not all questions will be used.

  • Choose relevant questions. For example, don't pick the question about parasites for a jellyfish interviewee.

  • All characters should use details when answering questions and stating descriptions. For example, the host should not describe a sponge interviewee's appearance and morphology as "He looks like a sponge."

  • Remember that the entire group is responsible for the answers given to interview questions, not just the actor. To plan the information, a simple script or bulleted list is recommended for each interview to ensure that the questions are all addressed accurately.

Project Materials

  • Audio recording device (such as a phone or computer)

Student Checklist


Chapter 29 Project

Scientific Presentation: Vertebrates

Project Goal + Timeline

In this project, you will be reviewing your knowledge of vertebrates by creating a short (approximately 15 minute) presentation focused on a specific vertebrate species. This project should be completed in a group of two students and should take approximately three hours to complete.

Directions

Part 1: Identify and Research Your Topic

Each group should try to select a different vertebrate phylum to present. You'll be taking a deep dive into a species of your choice for your presentation, so try to pick a species that's of interest to you!

Your presentation should include these components.

  • Introduction: Briefly list and explain the topics to be covered. Introduce your species and the class it belongs to.

  • Class Characteristics: Explain the major features that are common to all species of the class.

  • Class Phylogeny: Explain the evolutionary history of the class to which your species belongs, including the organisms from which the class descended, the major traits that emerged prior to and throughout the evolution of the class, and any other important events in the history of the class (such as extinction events or rapid diversification events). Show a cladogram or phylogenetic tree of the class and highlight where your species fits in the cladogram.

  • Species Characteristics: State and explain the defining physical characteristics of the species, including any sex differences in physical characteristics.

  • Species Information: Describe its current range, recent events in range expansion or restriction, feeding behaviors, mating strategies, seasonal behaviors, conservation status, and any current threats to the species.

  • Conclusion: Briefly highlight the major points made in your talk.

  • Questions: Include a slide after the conclusion of your presentation to encourage the audience to ask questions.

  • Bibliography: Include a slide at the end of your presentation that lists the references you've used.

Part 2: Design Your Presentation

Now that you've gathered your research, it's time to build your presentation. Keep the following additional tips in mind as you develop your presentation.

  • Estimate approximately 1 minute per slide. With this in mind, make around 15 slides for a 15-minute presentation.

  • Use descriptive titles for each slide. The title should orient the reader to what they'll be seeing and hearing about for the slide. For example, instead of "Phylogeny," a title like "Ornithorhynchus anatinus is one of the oldest living mammals" can be much more illustrative.

  • Stick to three to five bullet points per slide at most. Bullet points should contain key words, not complete sentences.

  • Make it readable. The general guidance for fonts is 28 to 40 point for headlines, 18 to 28 point for text, and 12 to 14 point for references. Make sure you have a strong contrast between the background and text, such as black text on a white background.

  • Use images. A single image is often much more engaging, informative, and memorable than text.

  • Include citations for any images and a bibliography slide at the end of your presentation.

Part 3: Practice and Present Your Talk

In designing a presentation, you've stuck to using short bullet points and images to show your key points. The bulk of the information needs to come from you and your partner explaining each slide.

It's helpful to run through your presentation at least two to three times before presenting. This will help you and your partner reinforce what you want to say for each slide, develop fluid transitions, and overall feel more comfortable when it is time to present. It also helps ensure your presentation fits the approximate time of 15 minutes. As you practice, focus on the key points you want to make (note them down if it helps) and improvise different ways of communicating them. Then, present to your classmates enthusiastically!

Project Materials

  • Computer with internet access

  • Presentation software

Student Checklist


Chapter 30 Project

Create an Herbarium

Project Goal + Timeline

In this project, we will be reviewing your knowledge of plant physiology by preparing an herbarium. An herbarium is a collection of pressed plant specimens, each of which is accompanied by detailed information about the specimen and how it was collected. After creating your herbarium, you'll write a short summary to highlight the special features your specimens have. This project should be completed within a group of two students over the course of a week.

Directions

Part 1: Collect Your Specimens

First, collect the plant specimens that will go into your herbarium. Some possible locations to collect specimens may include near your school, in your own garden, or in a park near your home. For any site you visit, make sure you have permission to collect from it.

Collect different parts from at least three different trees, bushes, flowers, or other plants. Try to collect a leaf and/or group of leaves, a stem, roots, and flowers, if applicable, from each plant.

For each sample, record:

  • the date of collection

  • the collection location

  • the habitat at the collection site

  • any specific details about the plant that may be helpful in identifying it

Part 2: Describe and Identify Your Specimens

Examine your specimens for their characteristics, including the types of leaves, flowers, stems, and roots. Describe the parts you collected from each of your three plants in Table 1. For the leaves, determine the form and arrangement. For the stems, determine whether they are soft or woody. For the flowers, describe the appearance and number of petals. For the roots, classify them as a fibrous or a tap root system, and describe any special modifications.

TABLE 1: Characteristics of Sampled Plants
Leaves Stem Flowers Roots
Plant 1 (blank) (blank) (blank) (blank)
Plant 2 (blank) (blank) (blank) (blank)
Plant 3 (blank) (blank) (blank) (blank)

Now, use this information, along with the descriptions of the plants you recorded while collecting, to try to identify each of the three plants. Consult published plant descriptions, illustrations, photographs, guidebooks, and online sources to identify each of your samples. Even if you are not able to identify your exact plant species, try to identify its genus or family.

As you're consulting sources to identify your plants, record any additional information you found about the plants. This information can include features of the plant that are not apparent from the specimens, such as the plant's fragrance, whether it produces fruit, its native habitat, etc.

Part 3: Press Your Specimens

Now, use a plant press to preserve your specimens. A simple plant press can be made from newspaper, cardboard, and something heavy, like a textbook. Arrange your specimens on a piece of newspaper, taking care to lay them in such a way to preserve their features. For example, spread out the petals of flowers and lay leaves flat. Then, fold the newspaper over the specimens, and set it on a piece of cardboard. Place a second piece of cardboard on top of the newspaper and use an elastic band to bind the cardboard pieces together. Place a textbook on top of the cardboard. Leave your samples in the press for several days.

Part 4: Prepare Herbarium Specimen Labels

Prepare a label for each of your specimens. Each label should be created on an index card or small piece of cardstock. Each label should contain:

  • the species' name (if known), the genus (if known), and the family

  • the common name, if known

  • the collection location (as exact as possible, such as the name of the park or geographic coordinates)

  • a description of the specimen (what part of the plant it is and what features it displays)

  • a description of the plant from which the specimen came

  • a description of habitat in which the specimen was found

  • the date of collection and name of collector

Part 5: Mount Your Specimens

After your plants have been in the press for several days, remove the textbook, carefully remove the elastic and cardboard, and then remove the specimens from the newspapers. Ensure the specimens are completely dry prior to mounting them.

On a piece of heavy paper, such as cardstock, lay out a specimen and its label. Once you're satisfied in the arrangement, roll clear contact paper over the arrangement to seal it to the paper. Then, repeat this process for each of your samples.

Part 6: Create a Summary to Accompany Your Herbarium

Create a one-page summary of the three plants whose structures are included in your herbarium. Your summary should provide a description of each plant, highlight any special features, and relate those features to the survival of the plant. For examples, do the form of the leaves suggest a specialized adaptation to a factor of the environment? How about the roots? Emphasize what makes each specimen in your collection unique and important for the overall study of plants.

Project Materials

  • Notebook

  • Pen or pencil

  • Access to site to collect plant specimens

  • Cardboard

  • Newspaper

  • Elastic bands

  • Index cards

  • Cardstock or other heavy paper

  • Contact paper

  • Computer with internet access, or field guide to plants

  • Textbook or other heavy object

Student Checklist


Chapter 31 Project

Plant Nutrition Experiment

Project Goal + Timeline

In this project, we will be reviewing your knowledge of soil and plant nutrition by investigating plant growth in response to different soil conditions. This project should be completed in a group of two students over three weeks.

Directions

Part 1: Plant Nutrition Experiment

What do you do with your leftover coffee grounds? Maybe throw them out? Believe it or not, there are many plants out there that would appreciate those grounds! Coffee grounds contain a good amount of nitrogen, some potassium and phosphorous, and even trace amounts of magnesium, calcium, and other minerals. All these elements are essential for plant growth. In this experiment, you'll be monitoring the response of plant growth to treatment with different levels of coffee grounds.

First, develop a hypothesis for how you think coffee grounds will impact the growth and appearance of plants grown from seedlings. Will more coffee grounds lead to more growth?

Next, obtain and label four 12-oz paper cups as "Control," "10% CG," "30% CG," and "50% CG." Then, add sterile potting soil and coffee grounds to each cup in the amounts provided in Table 1. Add some water to moisten (not drench) the soil. Use a wooden stick to mix the soil and coffee grounds together.

TABLE 1: Volume of Potting Soil and Coffee Grounds per Treatment
Treatment Sterile Potting Soil (tablespoons) Coffee Grounds (tablespoons)
Control 10 0
10% CG 9 1
30% CG 7 3
50% CG 5 5

Sprinkle a few seeds on the top of the soil in the cup. If the seeds are larger, you may need to push them into the soil. Use a spray bottle to mist water over the soil, or sprinkle water gently over the soil. Seeds can be from any plant, but tomato or pepper seeds may work best.

Place the cups together on a windowsill. Check the cups for plant growth daily. Record the date when germination (sprouting) first begins, and thereafter, monitor the appearance of the plants. Make sure to spritz the plants with water every day or so to prevent them from drying out. Allow your plants to grow for three weeks. At the end of each week, measure the heights of all plants in centimeters (cm) and describe their appearance.

Complete Table 2 with your findings. If seeds in a treatment never germinated, write "no germination" in the Number of Days Required for Germination column.

TABLE 2: Effect of Varying Levels of Coffee Grounds on Plant Growth
Treatment Number of Days Required for Germination Plant Height (Week 1) Plant Height (Week 2) Plant Height (Week 3) Plant Appearance Each Week
Control (blank) (blank) (blank) (blank) (blank)
10% CG (blank) (blank) (blank) (blank) (blank)
30% CG (blank) (blank) (blank) (blank) (blank)
50% CG (blank) (blank) (blank) (blank) (blank)

Part 2: Data Analysis and Conclusions

Create a line graph that shows the plant height versus time for your different treatments. Plant height will go on the y-axis, and time (in weeks) will go on the x-axis. Begin the x-axis with a time of 0 weeks, with a corresponding height of 0 cm for all plants. Each treatment should have three additional heights plotted, one for each week, 1 through 3. Different treatment points should be marked with different symbols or colors to easily identify each treatment. Make sure to label each axis and include units. Include a descriptive title for your graph and a key labeling each treatment.

Then, answer the following questions.

  1. Which treatment resulted in the greatest amount of growth and healthiest plant? Which treatment resulted in the least amount of growth?

  2. Did growth happen at a faster rate in certain treatments? Did growth rate differ between weeks for different treatments?

  3. Do your results support your hypothesis? If your results do not support your hypothesis, develop a new hypothesis to explain your results.

  4. Based on the results of your experiment and your responses to Questions 1 and 2, state a formal conclusion about the effect of coffee grounds on plant growth.

Part 3: Review Questions

  1. What elements are considered macronutrients in plants, and what are the functions of these macronutrients? What are some signs of macronutrient deficiency?

  2. Explain the benefits of rhizobia in legume root nodules and mycorrhizae around plant roots.

  3. Consider an insectivorous plant like the Venus flytrap. This plant can photosynthesize to create food. Why, then, does it also need to consume insects?

Project Materials

  • Sterile potting soil

  • 12-oz paper cups

  • Marker or pen

  • Seed packet (such as tomato or pepper)

  • Coffee grounds

  • Tablespoon (measuring spoon)

  • Wooden stick for stirring

  • Water

  • Graphing paper, or computer with graphing software

  • Pen or pencil

Student Checklist


Chapter 32 Project

Plant Reproduction Lab

Project Goal + Timeline

In this project, we will be reviewing your knowledge of plant reproduction by performing a flower dissection. This project should be completed within a group of two students in approximately two hours.

Directions

Part 1: Flower Dissection

Select a large flower, such as a lily, tulip, daffodil, or gladiolus, to dissect. Work through the following steps to dissect your flower. As you dissect, you can use your hands, scissors, or tweezers to carefully take apart your plant.

First, observe the sepals (the green, leaflike parts at the base of the flower) and the petals. Remove the sepals and petals by firmly holding the flower stem and gently pulling these structures away. Examine each, then set them to the side.

Observe the stamen. The stamen is made up of the filament (a stalklike structure) and anther (a cap-like structure that contains pollen grains). Carefully remove the stamen.

Observe the pistil. The pistil should appear as a slender, stalklike structure with a round base that is attached to the flower's stem. The rounded base is the ovary, which contains the ovules. The stalk is the style. The top is the stigma, which may be sticky. Carefully remove the entire pistil. Cut the pistil in half lengthwise with a razor blade.

Carefully scrape some pollen grains from the anther. Prepare a wet mount of the pollen grains by placing a small drop of water or glycerol on a glass microscope slide, place the pollen grains on the drop of water, and carefully lower a coverslip over the pollen grains. Observe the pollen grains using a light microscope. Focus the light microscope at the lowest power objective, and progress through the objectives until you've reached the highest power. Draw your observations in Table 1. Include the magnification under which you viewed the specimen.

Use a razor blade to carefully cut a thin section of the ovary from the pistil. Prepare a second wet mount of the ovary section using a microscope slide, coverslip, and drop of water. Observe the ovary under the lower objectives of the light microscope. Draw your observations in Table 1, including the magnification.

TABLE 1: Observations of Pollen Grains and Ovary
Pollen Grains Ovary
Drawing (blank) (blank)
Magnification (blank) (blank)

Tape one sepal, one petal, one stamen, and the pistil to Table 2. Label all parts of the structures, including the filament, anther, stigma, style, and ovary. Then, complete Table 3 by adding the description and function of each part.

TABLE 2: Flower Parts Collected during Dissection
Sepal Petal
(blank) (blank)
Stamen Pistil
(blank) (blank)
TABLE 3: Functions of Flower Parts
Structure Description Function
Sepals (blank) (blank)
Petals (blank) (blank)
Stamen (blank) (blank)
Pistil (blank) (blank)
Stigma (blank) (blank)
Style (blank) (blank)
Ovary (blank) (blank)
Anther (blank) (blank)
Filament (blank) (blank)

Part 2: Post-Lab Questions

Complete the following questions about reproduction in plants.

  1. Describe the structure of a pollen grain. How does a pollen grain change after it has encountered a pistil?

  2. Angiosperms reproduce through a double fertilization event. Explain the events that occur in the pistil that result in double fertilization.

  3. Identify one similarity and one difference between reproduction in gymnosperms and angiosperms.

  4. Plant populations benefit from the increased genetic diversity that results from crosspollination and the reduced competition facilitated by the dispersal of seeds away from a parent plant. Angiosperms have specialized adaptations to promote cross-pollination and seed dispersal. Provide at least two examples of such adaptations. Did the flower you dissected have any of these adaptations?

Project Materials

  • Large flower, such as a lily, tulip, daffodil, or gladiolus

  • Scissors

  • Tweezers

  • Microscope slides

  • Coverslips

  • Water

  • Glycerol (optional)

  • Razor blade

  • Light microscope

  • Project worksheet

  • Tape

  • Pen or pencil

Student Checklist


Chapter 33 Project

Scientific Poster: The Animal Body

Project Goal + Timeline

In this project, we will be reviewing your knowledge of the animal body through a poster presentation. You'll create a poster showcasing the body plan, tissue types, and maintenance of homeostasis in a specific animal. After creating your poster, you'll prepare a short presentation and present to the rest of the class. This project should be completed within a group of two to four students in three to four hours.

Directions

Part 1: Plan Your Poster

First, select the animal that will be the focus of your poster. Select an animal that is sufficiently complex so you can clearly discuss its body plan, tissue types, and processes through which homeostasis is maintained.

Once you've selected your animal, you will need to research it. Your goal is to obtain enough information so that you can structure your poster with the following components.

  • Poster title: Provide a descriptive title that accurately summarizes the information on your poster.

  • Introduction: Introduce the animal that is the focus of your poster, including its general features and habitat.

  • Main Poster Content

    • Body plan: Draw your animal (or provide an image of your animal) and describe its overall body plan. Describe any specialized features and discuss how the body plan relates the animal's functions and ability to survive.

    • Body cavities: Draw (or provide an image of) a cross section of your animal. Label and describe the body cavities, including the functions and contents of each.

    • Body tissues: Draw (or provide an image of) at least three of the major tissue types that make up your animal. Describe the structures and functions of each.

    • Thermoregulation and homeostasis: Describe how your animal maintains its body temperature and homeostasis. Outside of temperature regulation, describe at least one other homeostatic feedback loop in your animal. Provide a diagram of the feedback loop and label and/or explain all steps.

  • Conclusion: Summarize the major points made by your poster.

  • References (if applicable)

Use the internet to research the required information for the animal you've selected. Make sure to use reputable sources to obtain information. Keep track of the references and any images you use for your poster.

After researching your topic, decide your method to build your poster. You may choose to print out the text and images and paste them onto poster board. Alternatively, you may develop your poster in presentation software and have the poster printed out.

Part 2: Create Your Poster

Now, it's time to create! Keep in mind the final product should be approximately 48" wide by 36" high.

First, prepare the text. Write the text of your poster in word processing software before printing or copying to poster design software. Make sure to write a title that succinctly describes the content of your poster. Then, develop an introduction that provides background information about your animal.

Next, write the poster sections. For each, include the title of the section, the text, a figure, and a brief figure legend. Reduce text as much as possible to make your poster approachable and clear.

Prepare the figures you'll include in your poster. Make sure your figures have a clear connection to the content and are being used to either illustrate or further explain the ideas conveyed on your poster. You may choose to prepare any specialized figures in illustration software or by hand. If you use any figures from the internet, make sure to include a citation for the image. Design all figures that can be read from a distance (at least 2 feet away).

If you've consulted any outside resources, prepare a works cited list to add to your poster.

Now, you're ready to prepare the layout. As you work, keep the following in mind.

  • Ensure that your poster is the correct size (48" wide x 36" tall).

  • Choose a foreground color, background color, font, and font sizes that enhance clarity and visibility. Generally, 16-point font is the minimum font size to use for the smallest text on a poster.

  • Copy and paste your text and figures onto the poster or into poster presentation software, optimizing the layout of each.

  • Make sure that the title is written in a large font size so that it is clearly visible to anyone passing by. Add authors directly beneath the title in a smaller font size.

  • Ensure that your text, figures, and individual sections are surrounded by empty space so your poster doesn't seem too crowded.

  • Make sure all figures have a brief explanatory caption and a citation, if needed.

  • Ensure that all visual elements are properly aligned so that your poster appears symmetrical and harmonious.

  • Ensure that your poster is completely free of errors, typos, and grammatical mistakes.

Part 3: Present Your Poster

Prepare and rehearse a short, ten-to-fifteen-minute oral presentation for the rest of the class. Your presentation should start with a hook, some gripping information that will pique a listener's interest. Then, you should take the listener through your poster, explaining each section. Do not get bogged down in the details but rather focus on the big picture and major takeaways. Listeners who want to know more can always read the text and ask questions!

Bring your poster to your class poster presentation. Be available to take interested listeners through your poster, but also make sure you find the time to walk around, view other students' posters, and listen to their presentations.

Project Materials

  • Poster board or poster creation software

  • Computer with internet access

  • Printer

  • Paper

Student Checklist


Chapter 34 Project

Student's Digest

Project Goal + Timeline

The ability to digest food is essential to survival. The digestive system accomplishes this task through a complex multistep process that involves mechanical digestion, chemical digestion, and nutrient absorption. In this project, you will create a model of the digestive system that demonstrates these stages. You will also examine how modifications to a given stage may alter or disrupt digestion. This project should take between two and four hours to complete.

Directions

Part 1: Digestive System Model

In this part, you'll develop a model that emulates the steps in the digestion of a typical meal. You'll use crackers (such as saltines) and a drop of olive or vegetable oil to represent the combination of carbohydrates and fats that you might find in a meal. Follow the steps to construct your model. As you work, think about what each step represents and answer the corresponding question(s).

Place two crackers (such as saltines or graham crackers) and 1 teaspoon of olive oil in a small Ziplock bag. Add 2 to 3 tablespoons of water to mimic the presence of saliva. You may even include a small amount of your own saliva in the bag or a small portion of a digestive enzyme tablet containing amylase.

  1. Why would the addition of actual human saliva be appropriate at this stage?

Gently press on the bag for a few minutes to crush the crackers and mix everything together.

  1. What does this stage represent?

Add ¼ cup of vinegar to the bag. Then, fill a small bowl with hot water (not boiling, but hot) and place the bag in the bowl. Do not empty the contents of the bag into the bowl but rather allow the bag to soak. Allow this mixture to sit for 1 hour.

  1. What does this stage represent? What are some imperfections of the model in emulating this stage?

After the hour incubation, note the appearance of the mixture. Add a few small drops of a detergent and/or a digestive enzyme supplement to the bag, then gently mix the contents.

  1. Why should you add detergent? What part of digestion does this represent?

Place a coffee filter over the opening of a mug or small bowl. You can use a rubber band to secure the coffee filter, so it won't fall into the mug or bowl. Slowly pour the mixture from the bag into the coffee filter.

  1. What does the filter represent?

  2. What does the liquid that filters into the mug or bowl represent?

Carefully remove the filter and close it at the top, using the rubber band to tie the top of the coffee filter. Gently wring out any remaining liquid from the filter into the mug or bowl.

  1. What does the material that remains inside the filter represent?

Part 2: Digestive System Modifications

Now that you've completed a full model of the digestive system, let's investigate how modifications to the process can alter how food is digested.

Consider each of the possible modifications to the digestive system model constructed in Part 1. Complete Table 1 by identifying the type of digestive system or disorder the modification might emulate. Then, make a prediction about the effect of that change on your model of digestion.

TABLE 1: Modifications of Digestive System Model
Modification Demonstration of Digestive System or Disorder Prediction of Effect of Modification on Digestion
Crackers are not crushed after being placed in the bag. (blank) (blank)
Water is added to the bag in place of vinegar. (blank) (blank)
Detergent is not added. (blank) (blank)

Now, choose one of the changes from Table 1 and repeat the steps from Part 1 but with your modification.

  1. Describe any differences you observed between the results of your modified model and the results of the model constructed in Part 1.

  2. Do the differences you observed support your prediction for the effect of the modification?

Project Materials

  • Project worksheet

  • Pen or pencil

  • At least 4 crackers (such as saltines or graham crackers)

  • Olive oil

  • Measuring cups (teaspoons, tablespoons, ¼ cups)

  • Detergent (dish-washing soap)

  • Vinegar

  • Hot water

  • 2 Ziplock bags

  • 2 small bowls, or 1 bowl and 1 mug

  • 2 coffee filters

  • Rubber bands

  • Optional: Digestive enzyme tablets

Student Checklist


Chapter 35 Project

The Beat Goes On

Project Goal + Timeline

One of the best ways to understand the circulatory system is to test your own. In this project, you will investigate how heart rate reflects your physiological state by measuring your heart rate before and after performing certain activities. You'll analyze your results to identify activities that are associated with significant changes in heart rate. This project should be completed over the course of a day.

Directions

The circulatory system moves gases, nutrients, cells, and waste throughout the body. Since it regulates and transports many disparate molecules, the circulatory system needs to respond to a variety of stimuli. Your normal, everyday activities provide some of these stimuli. Things like eating, exercising, and performing certain movements may alter your blood pressure and/or your body's oxygen demands, and, in turn, your heart rate. To see this process in action, you'll measure your heart rate before and after performing the activities listed in Table 1.

There are several ways to measure your heart rate. A simple way is to measure the rate at your wrist by placing two fingers over the radial artery (on the thumb side of your wrist). Once you detect your pulse, count how many times you feel the pulse in 15 seconds. Multiply this number by 4 for a measurement in beats per minute (bpm).

For each activity listed in Table 1, complete Questions 1 through 3 and record your responses in the table.

  1. How do you think the activity will affect your heart rate? Make a prediction for the effect and provide a rationale for your prediction based on your knowledge of the circulatory system. You may also consider the relationship between blood pressure and heart rate in developing your rationale.

  2. Take three measurements of your heart rate before engaging in the activity and then again afterwards. What was your average heart rate before the activity and your average heart rate after the activity?

  3. Did the activity have a significant effect on your heart rate? Use Student's t test to determine if your mean heart rate after the activity significantly differed from your mean heart rate before the activity. To perform the test, you can use an online t test calculator.

    • Enter the three heart rate measurements taken before performing the activity in one column and your three heart rate measurements taken after performing the activity in the other column.

    • Conduct an unpaired t test.

    • Examine the p-value, which gives the probability that the differences in the means of your measurements were due to random factors. Generally, a p-value of less than 0.05 (5% chance the differences were due to random factors) is considered statistically significant. If your p-value is less than 0.05, you have strong evidence to conclude that the activity affected your heart rate.

    • Provide the p-value and state a conclusion about the effect of the activity in Table 1.

TABLE 1: Effect of Different Activities on Heart Rate
Activity Prediction for Effect of Activity on Heart Rate Heart Rate Before Activity (bpm) Heart Rate After Activity (bpm) Statistical Significance (p-value) and Conclusion
Perform one minute of exercise (such as jumping jacks, walking, jogging, or pushups) (blank) (blank) (blank) (blank)
(blank) (blank)
(blank) (blank)
Average:(blank) Average:(blank)
Eat a meal (blank) (blank) (blank) (blank)
(blank) (blank)
(blank) (blank)
Average:(blank) Average:(blank)
Stand up after sitting or lying down for at least 30 minutes (blank) (blank) (blank) (blank)
(blank) (blank)
(blank) (blank)
Average:(blank) Average:(blank)
Another activity of your choice:(blank) (blank) (blank) (blank) (blank)
(blank) (blank)
(blank) (blank)
Average:(blank) Average:(blank)

After completing Table 1, complete these questions.

  1. Compare your results for each activity to your prediction for each activity. Were your predictions supported? Do you think there were any confounding variables that affected your results?

  2. Which activity appeared to have the greatest impact on heart rate? Propose an explanation for why you obtained this result.

  3. Compare your results with those of a classmate. Were there any similarities? Why do you think this is?

  4. Describe the differences between a closed and open circulatory system. What is one benefit of a closed circulatory system compared to an open circulatory system?

Project Materials

Student Checklist


Chapter 36 Project

Inspirational Respiration

Project Goal + Timeline

We each typically take 20,000 breaths a day. The respiratory system quietly collects oxygen for delivery to your cells and expels the carbon dioxide released by your cells, generally without your conscious awareness. Since all cells require oxygen, the proper functioning of the respiratory system is essential to the proper functioning of all other body systems. As such, respiratory issues can have serious consequences throughout the body.

Doctors assess and monitor respiratory issues by measuring lung volumes. Lung volumes are the volumes of air in the lungs at different phases of the respiratory cycle. In this project, you will investigate your respiratory system by measuring and calculating your lung volumes. This project will take between one and two hours to complete.

Directions

In this project, you'll be measuring and calculating these lung volumes.

  • tidal volume (TV): the amount of air inhaled or exhaled during a normal breath

  • expiratory reserve volume (ERV): the additional amount of air that can be exhaled after a normal exhale

  • inspiratory reserve volume (IRV): the additional amount of air that can be inhaled after a normal inhale

  • vital capacity (VC): the sum of the tidal volume, expiratory reserve volume, and inspiratory reserve volume

  • functional residual capacity (FRC): the volume of air remaining in the lungs after a normal exhalation

  • residual volume (RV): the volume of air remaining in the lungs after a maximal exhalation

  • inspiratory capacity (IC): the maximum amount of air that can be inhaled after a normal exhale

  • total lung capacity (TLC): the maximal volume of air in the lungs after a maximal inhalation

  • forced expiratory volume in one second (FEV1): volume of air that can be forced out of the lungs in 1 second

Examine the image to better visualize the relationships among lung volumes.

A chart of human lung volumes and capacities

The chart shows the exchange of air during inhalation and exhalation, which resembles a wave pattern. During normal breathing, only about eight percent of air in the lungs is exchanged, and the amount of air in the lungs is one-half the total lung capacity. When a person breathes in deeply, total lung capacity is attained. The amount of air taken in is called the inspiratory capacity. Forceful exhalation results in expulsion of the expiratory reserve volume. A residual volume of air of about eight percent is left in the lungs. The vital capacity is the difference between the total lung capacity and the residual volume. The inspiratory reserve volume is the difference between the total lung capacity and the amount of air in the lungs after taking a normal breath. The functional residual capacity is the amount of air in the lungs after normal exhalation.

First, perform a series of lung volume tests using a balloon. These tests will allow you to measure your tidal volume, expiratory reserve volume, vital capacity, and forced expiratory volume for 1 second.

Complete three trials of each test described in Table 1. After each trial, measure the resulting diameter of the balloon (in centimeters). Record the diameter for each trial, then find the average balloon diameter for the three trials for each lung volume.

Take care when performing these exercises. Do not overexert yourself, and keep in mind any respiratory conditions you may have. If you feel discomfort, stop the activity, and resume normal breathing.

TABLE 1: Balloon Diameter Following Tests of Lung Volumes
Lung Volume How to Test Balloon Diameter Per Trial (cm) Average Balloon Diameter (cm)
Tidal Volume (TV) After a normal inhale, exhale normally (but not forcefully) into the balloon. Trial 1: (blank) (blank)
Trial 2: (blank)
Trial 3: (blank)
Expiratory Reserve Volume (ERV) After a normal exhale, place the balloon on your mouth and exhale the remainder of the air you can force into the balloon. Trial 1: (blank) (blank)
Trial 2: (blank)
Trial 3: (blank)
Vital Capacity (VC) Take a deep breath (maximum inhale) and force a maximum exhale into a balloon. Trial 1: (blank) (blank)
Trial 2: (blank)
Trial 3: (blank)
Forced Expiratory Volume in 1 Second (FEV1) Take a deep breath (maximum inhale) and force a maximum exhale into a balloon for only 1 second. Trial 1: (blank) (blank)
Trial 2: (blank)
Trial 3: (blank)

Next, convert your average balloon diameter into a volume. To convert from diameter (d) in centimeters to volume (V) in milliliters, assume the balloon is spherical and use the formula for the volume of a sphere:

V = 4 3 π d 2 3

Perform this calculation for each lung volume measured in Table 1. Record the results in Table 2. Table 2 provides a reference value (the expected value for the general population) for each lung volume for comparison.

TABLE 2: Measurements of TV, ERV, VC, and FEV1
Lung Volume Volume (mL) Reference Value (mL)
Tidal Volume (TV) (blank) 500
Expiratory Reserve Volume (ERV) (blank) 1,200
Vital Capacity (VC) (blank) 3,100
Forced Expiratory Volume in 1 Second (FEV1) (blank) 4,500

Finally, use your data from Table 2 to calculate the lung volumes in Table 3. Apply the calculation given in the table for each volume. Record the result of the calculation in the table.

TABLE 3: Measurements of FRC, RV, IRV, IC, and TLC
Lung Volume How To Calculate Volume (mL) Reference Value (mL)
Functional Residual Capacity (FRC) Estimate by multiplying FEV1 by 0.75. (blank) 2,400
Residual Volume (RV) FRCERV (blank) 1,200
Inspiratory Reserve Volume (IRV) VCERVTV (blank) 3,100
Inspiratory Capacity (IC) IRV + TV (blank) 3,600
Total Lung Capacity (TLC) VC + RV (blank) 6,000

Conclude this project by answering the following questions:

  1. The ratio of FEV1 to FRC is often used as a diagnostic criterion in medicine. What does this ratio reveal, and what conditions could it help diagnose?

  2. How do your results compare with the reference standards? How might you explain these results?

  3. Why is it not possible to measure residual volume (RV) directly?

  4. Your friend claims that if water is sufficiently oxygenated, humans can breathe underwater. Is their claim correct? Why or why not? Hint: Consider the comparative anatomy of a human and fish respiratory system.

Project Materials

  • Project worksheet

  • Pen or pencil

  • A balloon

  • A ruler that measures in centimeters

Student Checklist


Chapter 37 Project

Qualified Immunity

Project Goal + Timeline

Sometimes, the best way to understand a system is to find ways to challenge or disrupt it. Here, you will do that with the immune system. In this project, you'll develop a pathogen that can evade certain components of the immune system. Throughout the project, you'll consider how other immune system components might be able to combat the pathogen and identify similarities between your proposed pathogen and existing pathogens. At the end of this project, you'll develop a short news segment in which you'll act as a newscaster covering the emergence of your new pathogen. This project should be completed by yourself or with a partner over the course of a week.

Directions

Part 1: Design Your Pathogen

Our bodies harbor a complex and powerful immune system. Many different tissue and cell types work together to prevent and combat invading pathogens. These pathogens can take many forms, including viruses, bacteria, and fungi, necessitating the complex and adaptable immune system we have. Based on your knowledge of the immune system from the chapter, imagine a pathogen that can evade certain components of the immune system.

When developing your imaginary pathogen, propose one or more adaptations that it has to thwart some specific action by the immune system.

  1. What type of pathogen are you proposing (i.e., virus, bacterium, fungus, parasite, etc.)? How does this pathogen enter the body and spread? Draw your proposed pathogen and give it a name!

  2. What special adaptation are you proposing for this new species of pathogen?

  3. What part of the immune system is this adaptation specifically directed against? How does that part of the immune system normally work?

  4. How does this adaptation specifically thwart that part of the immune system?

Part 2: Identify Immune Defenses

Next, consider the other ways the immune system might respond to your pathogen.

  1. What other branches of the immune system might still be active against your imaginary pathogen? How do they work?

  2. What would infection with your pathogen look like? How long might it last, what symptoms might it produce, and how might it resolve?

  3. What medical intervention might be warranted to help combat this pathogen?

Part 3: Research Similar Pathogens and Conditions

In this part, use the internet or other resources to identify whether your imagined pathogen has a real-world equivalent.

  1. Are there any pathogens that have some resemblance to your imaginary one? How does the actual pathogen differ from your imagined pathogen?

  2. Are there any conditions in which individuals have reduced or altered functioning in the component of the immune system that was evaded by your imaginary pathogen? What symptoms or challenges do they face?

Part 4: Record a News Segment

Now that you've designed and investigated your pathogen, create a short (between one and three minutes) video segment introducing your pathogen. In the video, imagine yourself as a newscaster discussing the emergence of the new pathogen. Your segment should cover all information that you think would be important for viewers to be aware of regarding a new pathogen. For example, you may want to explain:

  • the general features of the pathogen

  • the adaptation that allows the pathogen to evade the immune system

  • how the immune system responds to the pathogen

  • the general progression of the illness caused by the pathogen

  • treatment options for infection with the pathogen

  • existing pathogens that are similar to the new pathogen

Keep your video segment short and concise. Highlight the facts and the information viewers would want to know. Limit the use of scientific terminology as much as possible so that the segment can be understood by a wide audience.

Project Materials

  • Project worksheet

  • Pen or pencil

  • Recording device (such as a phone or computer)

  • Computer with internet access

Student Checklist


Chapter 38 Project

Urine Trouble

Project Goal + Timeline

Elimination of nitrogenous waste is a critical issue for many multicellular organisms. Our body accomplishes this elimination, and much more, via the urinary system. For example, the urinary system removes urea (a nitrogenous waste product), regulates ion concentration, and maintains water balance within the body. Because of the essential functions performed by the urinary system, minor alterations to the system can result in impacts throughout the whole body.

Sometimes, the best way to understand a system is to find ways to challenge or disrupt it. Here, you will do that with the urinary system. The goal will be to make changes to the structure and function of the human urinary system at molecular, cellular, and tissue levels, and apply your knowledge from the chapter to predict the effects of these changes in isolation or when occurring together. This project should be completed on your own or with a partner and should take between one and two hours to complete.

Directions

Part 1: Molecular Change

Propose a molecular or biochemical change to the urinary system. This could be a change to the enzymes in the urea cycle, to the transport proteins in the cells (such as aquaporins), or to other molecular components.

  1. What are you changing and how?

  2. What is the normal function of the component you changed?

  3. How would your change affect the overall function of the urinary system? What broader impacts would the change have on host physiology?

Part 2: Cellular or Tissue Change

Propose a change to the structure of cells and tissues that make up the nephron.

  1. What are you changing and how? Draw a depiction both of a normal nephron and the altered version you have created.

  2. What is the normal function of the component you changed?

  3. How would your change affect the overall function of the urinary system? What broader impacts would the change have on host physiology?

Part 3: Organ or Organ System Change

Propose a change to the structure of the tissues in the kidney or a change to the entirety of the urinary system.

  1. What are you changing and how? Draw how you have rearranged the tissues and/or organs involved.

  2. What is the normal function of the component you changed?

  3. How would your change affect the overall function of the urinary system? What broader impacts would the change have on host physiology?

Part 4: Cumulative Changes

Now, consider how your changes occurring in tandem or all together could affect human physiology. Fill out Table 1 by first describing the effect each of your proposed changes in isolation has on the physiological parameters given in the table. You can also provide additional physiological parameters that may be affected by the changes. Then, consider the effect of pairs of two of these changes occurring in tandem. Finally, consider the effects of all three of these changes occurring.

TABLE 1: Effect of Urinary System Changes on Physiological Functions
Changes Removal of Nitrogen Removal of Salts and Wastes Blood Pressure Other Physiological Parameters
Molecular (blank) (blank) (blank) (blank)
Cell/Tissue (blank) (blank) (blank) (blank)
Organ/Organ System (blank) (blank) (blank) (blank)
Molecular & Cell/Tissue (blank) (blank) (blank) (blank)
Molecular & Organ/Organ System (blank) (blank) (blank) (blank)
Cell/Tissue & Organ/Organ System (blank) (blank) (blank) (blank)
Molecular & Cell/Tissue, & Organ/Organ System (blank) (blank) (blank) (blank)

Now, consider one or more of your proposed changes.

  1. Compare and contrast your proposed change(s) with an excretory system found in another animal. Does the change make the human urinary system more similar to another type of excretory system?

Project Materials

  • Project worksheet

  • Pen or pencil

Student Checklist


Chapter 39 Project

Welcome Aboard the Endocrine System!

Project Goal + Timeline

In this project, we will be reviewing your knowledge of the endocrine system by writing a set of instructions for three different hormones for their first day on the job. This project should be completed by yourself or with a partner within two to four hours.

Directions

You're in charge of training three hormones—ADH, FSH, and insulin—for their first day on the job. Write a set of instructions for each of these hormones to follow. Imagine these instructions serve as a helpful guide for a hormone, instructing it on what to do, where to go, and what to watch out for. Create these instructions to be given to each hormone immediately after it is synthesized.

For each set of instructions, include five parts: Role Overview, Finding Your Way Around, Meet Your Team, On the Job, and Be Aware. Following are detailed instructions for each part.

Note: The hormone FSH works differently in males and females. You need only describe the role in one sex.

Part 1: Role Overview

This part describes the "big picture" role to which this hormone contributes. After a quick welcome message, you should mention and define homeostasis. Then explain the hormone's overall role in maintaining homeostasis. This includes specifying which aspect of bodily function this hormone will help manage (excretory, reproduction, or metabolism). For example, this part may use phrases such as, "As a member of the (blank) system, you manage (blank)."

Feel free to use the italicized text to get started if you like, but you are encouraged to customize the welcome message! After this italicized part, you should describe the big-picture contribution of this hormone. The suggested word count for this part is 150 to 200 words.

"Welcome to your new position, hormone (blank)! The first day on the job can be an exciting but sometimes stressful time! You must learn new systems and meet your coworkers.

You have an essential job. We pride ourselves on our rapid response and fluid communication as an endocrine system. This short guide will help you breeze through your first day and establish your place as a superstar team member! As a member of the…."

Part 2: Finding Your Way Around

This part shows all body parts and structures that are essential to the hormone. No text is required here except for the map labels. Develop a map of a human body. The map can be a simple outline. Do not try to depict all human body organs and structures. Only show those parts that are essential for that hormone's primary function. Maps can be computer generated or hand drawn. Your map must include two things:

  1. Include a "You Are Here" marker. This shows where in the body that hormone was synthesized. Assume that is the hormone's starting location. For example, the starting location for the hormone glucagon would be the pancreas.

  2. Include all the major locations where this hormone will operate. Where is the hormone stored? Where must it travel to operate? Include these body locations and label them. For example, if glucagon's route were described, the liver would be marked as a major location.

Part 3: Meet Your Team

This part introduces an important "coworker," or another hormone that interacts directly with the primary hormone. Include an image of the coworker hormone. Internet images and computer-generated images are fine.

Then, describe the coworker hormone's role in three to four sentences. You don't need to go into too much detail here because more detailed interactions will be described in Part 4. The suggested word count for this part is about 50 to 70 words per "coworker."

For example, glucagon works closely with the hormone insulin. So, insulin would need to be introduced.

Part 4: On the Job

This part describes the hormone's specific job duties. Keep in mind that Part 1 already explained the "big picture;" this part explains the specific details. A majority of this part should cover the various stimuli to which this hormone responds.

Identify which stimuli activate this hormone; be sure to use the word "stimulus." Then clearly state how the hormone should respond to each stimulus. For this part, you may choose between two formats: either (a) a written explanation or (b) a flow chart. If you go with the written explanation, the suggested word count is 150 to 200 words.

For example, glucagon would be described as responding to blood glucose concentration. When blood glucose drops (that's the stimulus), glucagon should respond by leaving the pancreas. Explain where the hormone goes next. What will the hormone encounter?

Part 5: Be Aware

This part explains the consequences of failure. Emphasize this hormone's importance by explaining, generally and specifically, what happens to the body if this hormone doesn't work correctly. Emphasize homeostasis and explain how this hormone's failure could disrupt homeostasis. Then explain why that failure would hurt the body.

Conclude this part with one specific example of a disease or disorder in which this system (excretory, metabolic, or reproductive) has failed and discuss the hormone's role in that disease or disorder. The suggested word count is 125 to 150 words.

To finish your project, compile each set of instructions into an appealing brochure or booklet. Make sure to make a separate brochure for each: ADH, FSH, and insulin.

Project Materials

  • Computer with a word processor

  • Printer

  • Paper

  • 1 pen or pencil

  • Optional: Markers or other art supplies for drawing maps

Student Checklist


Chapter 40 Project

Concept Mapping Animal Reproduction

Project Goal + Timeline

In this project, we will be reviewing your knowledge of the reproductive system by designing a concept map to explain animal reproductive systems.

Concept maps are a powerful way to visualize relationships between the many ideas that make up a complex topic—in this case, animal reproductive systems. Starting with a list of terms, you will create an extensive network of interconnected terms with each term in its own bubble. This will be your concept map. Terms written in big bubbles should indicate larger, more encompassing ideas than terms written in smaller bubbles. All terms should be connected to other terms by arrows, and all arrows must include a written explanation for that relationship.

You'll start this project by completing a practice concept map to better understand the process, and then you'll complete your concept map of animal reproduction. This project should be completed by yourself or in a group within two hours.

Directions

Part 1: Design an Example Concept Map

In this part, complete a quick example of a concept map to familiarize yourself with the process. Fill in the empty bubbles and rectangles with appropriate terms surrounding the central idea of "Trees."

Terms: oxygen, animals, is essential for, consume, produces, provide, is used to make, paper, houses

A partially filled in concept map about trees

The concept map starts with "Trees" as the central idea. There are three branches off of "Trees": "produce," a blank to be filled in, and another blank to be filled in. "Produce" points to another blank to be filled in. That blank branches off into "is essential for," which points to "plants," and another blank, which points to a blank. The second branch off of "Trees," which was a blank, points to "carbon dioxide." The third branch off of "Trees," which was a blank, points to "wood." There are three branches off of "wood": "undergoes," "is used to make," and another blank. The "undergoes" branch points to "combustion," which then points to a blank. That blank points to the "carbon dioxide" mentioned earlier. The "is used to make" branch points to another blank. The third branch off of "wood," which was a blank, points to another blank.

Part 2: Develop an Animal Reproduction Concept Map

Your central idea in the concept map should be animal reproduction. Use your concept map from Part 1 for guidance on getting started. Be aware that the animal reproduction concept map will be more complicated and will contain more complex idea branching.

Include the following terms in your concept map: animal reproduction, asexual reproduction, sexual reproduction, germline, gametogenesis, human reproduction, spermatogenesis, oogenesis, ovarian cycles, menstruation, sperm, egg, embryo, zygote, fertilization, infertility, infertility treatment options, contraception, animal development, cleavage (animal development), gastrulation (animal development), embryogenesis and organogenesis, fission (binary fission), budding

Include at least one specific example of the following: contraception, asexually reproducing species, sexually reproducing species, options for treating infertility

Hint 1: If the list of terms seems overwhelming, it may help to begin by grouping the terms into big ideas and little ideas.

Hint 2: Start by drawing rough drafts. Once you're satisfied with your rough draft, draw your final concept map neatly on a blank piece of paper or create it on a computer.

Technical requirements are as follows:

  • Each term should appear in a separate bubble.

  • Use every term from the list. Feel free to include additional terms.

  • Every term should be connected to at least one other bubble.

  • Every arrow connecting terms should include a written explanation of that relationship.

Part 3: Complete Review Questions

Finish your project by answering the following questions:

  1. Describe some methods of asexual and sexual reproduction.

  2. Describe advantages and disadvantages of asexual and sexual reproduction.

  3. Discuss causes of infertility and the therapeutic options available.

Project Materials

  • Tree concept map

  • Blank sheets of paper

  • Pen or pencil

  • Project questions

  • Optional: Access to a computer

Student Checklist


Chapter 41 Project

Sensational Science!

Project Goal + Timeline

In this project, we will be reviewing your knowledge of sensory systems by creating four educational comics that answer questions about the sensory systems. This project should be completed by yourself or within a group within two hours.

Directions

Draw four educational comics. Imagine you're an artist who creates comics for a newspaper. Kids write to you asking you biology questions, and you answer with a comic. Sensational Science! is this month's theme, and you are answering questions related to sensory organs and systems.

Your comic can be a single pane or a sequence of panes; choose whichever works best for each question. You also choose how to present your answer. For example, you may do something straightforward, such as drawing a cartoon of a teacher explaining the answer. You are encouraged to be creative, so feel free to experiment with different approaches for different questions.

Pick four of the student questions to answer with a comic. A list of terms required in the answer is given after each question.

Student Questions:

  1. Sebastian asks, "How does my skin know when I touch something hot? How does it know when I touch something cold? Why are different parts of my body more sensitive to pain than others? For example, why is the skin on my fingertip so much more sensitive to touch than the skin on my arm?" (Required terms: glabrous skin, hairy skin, free nerve endings, Merkel's disks, Meissner's corpuscles, Ruffini endings, and Pacinian corpuscles)

  2. Jacklyn asks, "How do my eyeballs work? Where does the light go when it hits my eyeball?" (Required terms: retina, cornea, lens, iris, pupil, fovea centralis, photoreceptors, and rhodopsin)

  3. Augustine asks, "My teacher talks about sound 'waves' and also light 'waves.' That confuses me because if sound and light are both waves, then why can't I see sounds? Why can't I hear light?" (Required terms: audition, medium, stereocilia, electromagnetic, photoreceptors, rods, and cones)

  4. Cassidy asks, "What does it mean when my teacher says that humans have five 'special' senses? What are the non-special senses and how are they different from 'special' senses? Does that mean that humans have different senses than some animals? And animals can have different 'special' senses than me? If so, what are some senses animals have that I don't? (Required terms: somatosensation, vestibular sense, proprioception, and kinesthesia)

  5. Tyrone asks, "My teacher says dogs' noses are so good that some dogs can even smell when someone has cancer! Why does a dog's nose work so much better than mine? Can I make my nose smell as well as a dog? What's different between a dog-nose and a person-nose? Can a dog see better than me too? (Required terms: odorants, olfactory, olfactory receptor, olfactory epithelium, dichromatic, and trichromatic)

Technical requirements:

  • Use and define all the required terms that are listed after each question.

  • Your comic can be a single pane or a sequence of panes. Choose whichever works best for each question.

  • Draw or print out all four comics on separate sheets of paper.

  • All comic art should be hand drawn or computer generated by you. Stencils, rulers, or other tools can be used.

  • Please create your own art. But don't worry! You need not be a skilled artist to earn full credit on this project. Just ensure that the comic is tidy and that the necessary details are represented. Labels can help to identify artwork details that may be unclear.

  • Text/written explanations must accompany all art. Those explanations can take different forms. For example, the text could be dialogue, or it could be an explainer-type text along the bottom of your comic.

Project Materials

  • 4 pieces of blank paper

  • Drawing supplies (markers, colored pencils, pens, etc.)

  • Optional: Ruler

  • Optional: Computer with printer

Student Checklist


Chapter 42 Project

Presenting Nervous System Disorders & Toxins

Project Goal + Timeline

In this project, you will review your knowledge of the nervous system by making a 12- to 15-minute digital presentation about a neurotoxin or a neurological disorder. This project should be completed in groups of three and should take between three and four hours.

Directions

Your group will be assigned either a neurotoxin or a neurological disorder from the following list: Sarin gas, botulinum toxin, tetanus, tetrodotoxin, lead, ethanol, glutamate, nitric oxide, methylmercury, arsenic, Alzheimer's disease, Parkinson's disease, Wernicke-Korsakoff syndrome, or Guillain-Barré syndrome.

The digital presentation must contain an appealing balance of graphics and text. It should contain enough text that the presentation can be understood without the spokesperson but not so much text that the spokesperson has nothing new to add and need only read from the slides.

The three group roles are as follows:

Spokesperson: The spokesperson is responsible for presenting the presentation. This person should clearly and articulately discuss the subject. They should appear practiced and deliver the presentation within the time restrictions. A brief Q&A should follow the presentation, in which the spokesperson should either answer questions themselves or defer questions to specific group members.

Graphic Designer: The graphic designer is responsible for the visual aspects of the presentation, including the graphics and overall organizational layout. The graphic designer must also ensure that the digital presentation contains visual cues or aids to help the spokesperson. These cues could be anything that makes the spokesperson's job easier. For example, they may include bulleted lists to guide the spokesperson or interactive "fly in" reminders. Note: The graphic designer is not responsible for creating the entire presentation, but they do have final say on decisions regarding graphics and layout. They are also not any more responsible for actual factual content than any other group member.

Project Manager: The project manager is responsible for ensuring that everyone is on track and that all information and plans are shared among group members. The project manager should take notes during all planning discussions and email those notes to group members. They should help organize the group effort to develop the presentation and delegate specific tasks as needed. They should also work one-on-one with the spokesperson to practice presentations. Finally, they should work with the graphic designer to ensure that visual content is shared with the spokesperson and that the spokesperson in satisfied with the presentation layout. The project manager must submit a 200-word summary of how and when (including dates) they satisfied these responsibilities. They must accompany this summary with two pieces of evidence. (This evidence could include emails, such as the email summary of group discussions.) Alternatively, a signed statement from another group member could suffice (for example, a signed statement from the spokesperson that the project manager helped them practice their presentation).

Note: All group members are responsible for working together to develop the content that will be included in the presentation as well as ensuring the factual accuracy of the digital presentation. The purpose of the roles is so that each person is also accountable for a major aspect of the project. All group members are equally responsible for making sure the presentation includes all the content requirements in the following checklist.

The following are the presentation's content requirements. All requirements must be met but not necessarily in this order.

  • Introduce your toxin/disorder with background information about its history, discovery, source, or any other relevant information.

  • Introduce the nervous system by showing the organizing of the CNS and PNS. Identify the spinal cord, cerebral lobes, and other brain areas on a brain diagram.

  • Would this toxin/disorder affect primarily the CNS, PNS, or both? Specify which parts of the nervous system would be most affected.

  • Show and describe the general structure of a neuron. Explain the primary functions of each part of the neuron. Include a discussion of the function of myelin.

  • List the four neuron types and specify which are affected most directly by the toxin/disorder.

  • Would this toxin/disorder affect an individual neuron's structure? If so, explain how.

  • Include a brief description of how a regular action potential works. Describe the basis of the resting membrane potential. List the stages of an action potential.

  • How would your toxin/disorder affect action potentials, if at all? If applicable, explain in detail the mechanism through which the toxin/disorder exerts its effect.

  • Include a brief description of synaptic function.

  • How would your toxin/disorder affect communication at the synapse, if at all? If applicable, explain in detail the mechanism through which the toxin/disorder exerts its effect.

  • How does the toxin/disorder affect the functioning of the entire body? For example, does it result in paralysis? Is it fatal? Explain how the effect of the toxin/disorder at the neuronal level leads to this whole-body effect.

  • If your presentation covers a neurotoxin, research nervous system disorders and find one with similar effects. Compare and contrast.

  • If your presentation covers a neurological disorder, research neurotoxins and find one with similar effects. Compare and contrast.

Project Materials

  • Computer with digital presentation program (such as PowerPoint) and internet access

  • Pen and paper (for planning)

Student Checklist


Chapter 43 Project

No Bones About It

Project Goal + Timeline

The musculoskeletal system is essential for the body's movements and many of its processes. Notably, bones support the body and protect its vital organs. As such, proper maintenance of bone health is critical to an active and healthy lifestyle. In this project, you will consider different disorders that disrupt bone health and predict the effect of potential treatments designed to affect bone homeostasis. You'll work with a partner to make your predictions. Then, you'll check your predictions against the literature to see what the actual effects of the treatments are. This project should take between one and two hours to complete.

Directions

Whether it is from injury, insufficient diet, genetic disposition, or aging, a failure of bone homeostasis can have major impacts on one's health and quality of life. Osteoporosis is one condition that results from a failure of bone homeostasis. In osteoporosis, the creation of new bone does not occur quickly enough to keep up with the removal of old bone. This imbalance may occur due to the body's failure to form new bone, the body's removal of too much of the old bone, or a combination of both processes. Osteoporosis causes bones to become porous, weak, and brittle, such that they are much more likely to break in response to a minor fall or impact. Risk factors for osteoporosis include age, sex (more common in females), hormonal imbalances, certain autoimmune conditions, insufficient calcium and vitamin D, a sedentary lifestyle, and smoking.

Bisphosphonates are one potential treatment for conditions of altered bone homeostasis. Bisphosphonates are a group of drugs that preferentially bind to calcium ions. As a result, they are rapidly absorbed into new bone. When liberated from the bone, bisphosphonates attach to and enter osteoclasts. Bisphosphonates inhibit the activity of osteoclasts and can cause the death of these cells.

  1. What is the function of osteoclasts?

  2. Based on your answer to Question 1, why might bisphosphonates be helpful in treating osteoporosis?

  3. What general prediction can you make about the effect of bisphosphonates on bone homeostasis?

Imagine you are designing a series of experiments to test the effect of bisphosphonates on different conditions. First, you'll investigate the effects of bisphosphonates on osteoporosis. Divide patients with osteoporosis into the treatment groups described in Table 1. Work with your partner to complete the table with your predictions for how each treatment will affect bone strength, integrity, and resistance to fractures as well as how each treatment will affect blood calcium level.

TABLE 1: Predictions of Effects of Bisphosphonates on Osteoporosis
Dietary Calcium Bisphosphonate Treatment Prediction for Bone Health Prediction for Blood Calcium
Low None (blank) (blank)
Low High (blank) (blank)
High None (blank) (blank)
High High (blank) (blank)

Next, perform a literature search to locate at least two studies that investigated the effects of treatment with bisphosphonates on osteoporosis. Provide the article author(s), title, publication year, and journal title in Table 2.

TABLE 2: Sources for Effects of Bisphosphonates on Osteoporosis
Article 1 Article 2
Author(s) (blank) (blank)
Title (blank) (blank)
Publication Year (blank) (blank)
Journal Title (blank) (blank)
  1. Summarize the findings in the articles you found. What do the studies indicate about how bisphosphonates affect osteoporosis?

  2. Compare the findings in the articles to your predictions in Table 1. Were your predictions supported or not supported by the studies? Were any of the findings in the studies surprising?

  3. A sedentary lifestyle is a risk factor for osteoporosis, and physical activity is recommended to help prevent osteoporosis. Propose a mechanism through which physical activity helps prevent osteoporosis.

Next, you decide to investigate how bisphosphonates affect recovery from a fracture in patients without osteoporosis. Divide patients with fractures into the different groups described in Table 3.

  1. Describe the stages in the recovery from a fracture. In what way(s) may treatment with bisphosphonates affect this process?

Complete Table 3 with your predictions for how treatment with bisphosphonates and calcium would affect fracture healing (including the degree of repair and the shape and function of repaired bone) and blood calcium level.

TABLE 3: Predictions of Effects of Bisphosphonates on Fracture Healing
Dietary Calcium Bisphosphonate Treatment Prediction for Fracture Recovery Prediction for Blood Calcium
Low Only in the first two months after fracture (blank) (blank)
Low From the third month to the sixth month after fracture (blank) (blank)
High Only in the first two months after fracture (blank) (blank)
High For all six months after fracture (blank) (blank)

Next, perform a literature search to locate at least two studies that investigated the effects of treatment and timing of treatment with bisphosphonates on fracture recovery. Provide the article author(s), title, publication year, and journal title in Table 4.

TABLE 4: Sources for Effects of Bisphosphonates on Fracture Recovery
Article 1 Article 2
Author(s) (blank) (blank)
Title (blank) (blank)
Publication Year (blank) (blank)
Journal Title (blank) (blank)
  1. Summarize the findings in the articles you found. What do the studies indicate about how bisphosphonates affect recovery from a fracture?

  2. Compare the findings in the articles to your predictions in Table 3. Were your predictions supported or not supported by the studies? Were any of the findings in the studies surprising?

As you've seen, both the process of bone recovery after a fracture and treatment with bisphosphonates can reduce the amount of calcium in the blood. A reduction in calcium affects the muscular system.

  1. Describe one way that calcium is involved in muscle contraction.

  2. Considering your response to Question 10, how will a reduction in calcium likely affect muscle contraction?

Project Materials

  • Project worksheet

  • Pen or pencil

  • Computer with internet access

Student Checklist


Chapter 44 Project

Fellowship of the Ecosystem

Project Goal + Timeline

In this project, you will think like an ecologist to analyze and classify mythological or fantastical ecosystems from books, films, or television. You will consider the abiotic and biotic factors of each ecosystem as presented in the source material and then apply your knowledge to classify the ecosystems. Based on your classification, you'll identify inconsistencies in the ways the ecosystems are presented in the source material. Finally, you will prepare a brief (10- to 15-minute) presentation showcasing your analysis of the ecosystems. This project should be completed with a partner and should take between four and eight hours to complete.

Directions

Understanding the dynamics by which the biosphere and environment change is critical to the health of our species and many others. These dynamics are understood through the study of ecology. By stretching ecological concepts into the realm of fantasy, you can gain a better appreciation of both their utility and limitations.

Your task is to think like an ecologist to analyze, classify, and make predictions about ecosystems from works of fantasy, science fiction, or mythology. Work with your partner to select your source material and specific ecosystems to analyze. You may select any fantasy, mythological, or science fiction environment that is described in sufficient detail. The ecosystems could come from a book, movie, or television show. Try to identify at least two ecosystems from the same source material to analyze and compare.

Once you've selected your ecosystems, it's time to study them. Read or watch your source material and record all distinguishing features of the ecosystems, including their abiotic factors, climates, vegetation, and animals. Complete Table 1 with the features of each ecosystem you've selected.

TABLE 1: Features of Selected Ecosystems
Ecosystem 1:(blank) Ecosystem 2:(blank)
Abiotic factors (blank) (blank)
Vegetation (blank) (blank)
Animals (blank) (blank)
Climate (blank) (blank)
Any other distinguishing characteristics (blank) (blank)

Continue your analysis by completing the following questions.

  1. Based on the characteristics you described in Table 1, identify the biome to which each ecosystem is most similar. Explain your reasoning.

  2. For each ecosystem, describe the key factors that limit what type of organisms can live there. For example, is the temperature extreme? Is water limited?

  3. Based on your classification in Question 1 and key factors identified in Question 2, what additional characteristics can you infer about these ecosystems that are not explicitly stated in the source material?

  4. Based on the climate and characteristics of each ecosystem, what other ecosystems would you predict to be found nearby?

  5. Consider how each ecosystem is depicted in its source material. Based on your classification and analysis of the ecosystem, are there any factors that seem out of place, either in the ecosystem or its surrounding region?

  6. Are there any ways in which the standard definitions of biomes are not applicable to the ecosystems that you've selected?

  7. Are there any threats to the ecosystems in your source material (for example, hunting, pollution, or wildfires)? How are these threats likely to impact the ecosystems?

Now that you have analyzed your ecosystems, work with your partner to prepare a digital presentation to showcase your fantasy ecosystems in detail. Your presentation should highlight and expand on the findings of your analysis. The following are some additional questions to consider:

  • What types of organisms would you expect to find in each ecosystem? What types of interactions (e.g., mutualism, predation) would you expect to take place between or among these organisms?

  • Based on the ecology of the area, are any of the mythical creatures or characters out of place?

  • Consider the other ecosystems you'd expect to be found in regions surrounding the ecosystems you chose. Does that match the story? Why or why not?

  • How certain are you in your analysis of the ecosystem? Is there any additional information you need to know to make a definite categorization of the ecosystem and its surrounding region?

Your presentation should also include images that compare the mythological ecosystems to the biomes to which they are most similar. Make sure to begin your presentation by providing some brief information about the story to provide context for the ecosystems you've chosen.

Project Materials

  • Project worksheet and a pen

  • Access to media, such as a book, movie, or television show

  • Computer with internet access

  • Presentation software, such as Microsoft PowerPoint

Student Checklist


Chapter 45 Project

Bee-havior

Project Goal + Timeline

In this project, you will apply what you have learned about population biology, ecology, behavior, and natural selection as you develop a report on bees and other Hymenoptera species. In order to prepare for your report, you will outline information about two different species and then answer some discussion questions. This preliminary work will help you form an outline from which you can prepare your report. You should complete this project with a partner. Plan to conduct your research and prepare your report over one to two days.

Directions

You've likely encountered a species from the phylogenetic order of Hymenoptera before—just think of the last time you saw an ant or a bee. The honeybee is known for its well-named, sweet condiment (honey!) as much as it and other members of the order might be associated with the unpleasant shock from its stinger. Further still, the role bees play as pollinators underscores the complex relationship we have with this species.

It is no surprise, then, that this species and its relatives can be used to examine several different complex aspects of biology and ecology, including the intersection between behavior and population dynamics. In this project, you will analyze and compare aspects of the population ecology and behavior of two different Hymenopteran species. You and your partner could each research a single species or research both species together. Then, compare notes after you have read about the life history and behaviors of your selected species.

  1. What two species will you compare? How are they related within the order?

  2. For each species, describe its life history strategy. Would you categorize each as an r-selected or K-selected species? Why?

Identify three behaviors that are observed in each species. Add the behaviors of your first species (Species 1) to the first row of Table 1 and the behaviors of your second species (Species 2) to the first row of Table 2. Then, answer the questions about each behavior in Table 1 and Table 2.

TABLE 1: Behaviors of Species 1
Behavior Description Behavior 1:(blank) Behavior 2:(blank) Behavior 3:(blank)
What is the stimulus that triggers the behavior? (blank) (blank) (blank)
What function does the behavior provide for the organism? (blank) (blank) (blank)
How did the behavior likely evolve? (blank) (blank) (blank)
How does the behavior develop or change over the life of the organism? (blank) (blank) (blank)
TABLE 2: Behaviors of Species 2
Behavior Description Behavior 1:(blank) Behavior 2:(blank) Behavior 3:(blank)
What is the stimulus that triggers the behavior? (blank) (blank) (blank)
What function does the behavior provide for the organism? (blank) (blank) (blank)
How did the behavior likely evolve? (blank) (blank) (blank)
How does the behavior develop or change over the life of the organism? (blank) (blank) (blank)

Now, select one of the behaviors for each species and reflect on its connection to the previous questions.

  1. How does the behavior contribute to the species' life history and categorization as an r-selected or K-selected species?

  2. If the species had the opposite r- or K-selection categorization, how would you expect this behavior to change?

Honeybees, and many other species of Hymenoptera, display complex social interactions and a hierarchical hive structure (known usually as hives or colonies). Honeybees are considered a eusocial species, in which a single female produces offspring and nonreproductive individuals work together to care for these offspring.

  1. What is an example of an innate behavior present in sterile honeybee workers? How does this behavior evolve if these bees are unable to reproduce? What type of evolution does this represent?

  2. What are some of the factors that influence the carrying capacity of a honeybee colony or a population of either of the two species you chose?

Colony collapse disorder is a phenomenon in which many of the worker bees disappear from a colony, leaving the queen, larvae, and food behind. When answering the following questions, consider how such a challenge may affect the distribution of individuals in a population of Hymenoptera.

  1. What would the age structure diagram look like for a honeybee colony that is increasing in size?

  2. What would the age structure diagram look like for a honeybee colony that is mildly decreasing in size, perhaps due to a decrease in flower availability?

  3. What would the age structure diagram look like for a population that is suffering from colony collapse disorder, in which worker bees have disappeared?

  4. What other populations would colony collapse disorder effect? What ecological or agricultural impacts do you predict from this phenomenon?

Now you should have an outline of the life history and behaviors of your two species along with a perspective of how different factors shape a population's structure and behavior. You and your partner should use this outline to develop a short report (two to four pages) in which you address the following:

  • Compare and contrast the two species and their life history

  • Connect the life history and evolution of the species to specific behaviors, both innate and learned (such as spatial learning)

  • Include an analysis of the challenges populations of both species face

Project Materials

  • Project worksheet

  • Pen or pencil

  • Computer with a word processor and internet access

Student Checklist


Chapter 46 Project

Backyard Ecology

Project Goal + Timeline

In this project, you will apply what you have learned about ecosystems and energy flow to your own surroundings. You'll select a study site, such as your backyard, a local park, a pond or river, or other nearby area, and observe and characterize the ecosystem at the site. Then, you'll use your observations to make predictions about the disruptions caused by ecosystem change. You may complete this project alone or with a partner. This project should take between two and three hours to complete.

Directions

Ecosystems are not abstract concepts designed for the pages of a biology textbook; they are real, vibrant, and complex collections of organisms and environments that are all around us and across the planet. There is likely an ecosystem right outside your door that provides the perfect test site for you to apply the principles and ideas you have learned in this chapter.

This project will require you to step outside, or if necessary, travel to a nearby area to complete this activity. Keep in mind that life is teeming everywhere; even a small plot of soil maintains a rich, dynamic, and vibrant ecosystem. You may want to take a copy of the questions listed here with you to make it easier to complete this field work.

  1. What area have you selected? What broad type of ecosystem is this area? How can you tell?

Survey the site and identify as many living things as you can, noting their relative abundance in the environment. Organisms can be categorized in an ecosystem by the way in which energy flows through them. Give examples of an organism for each of the following categories and explain how you made this determination.

  1. What is an example of a primary producer in the area?

  2. What is an example of a primary consumer in the area?

  3. What is an example of a secondary consumer in the area?

  4. What is an example of a tertiary consumer in the area?

  5. Why is it unlikely that you would find a quaternary consumer at the apex?

  6. Of the species you observed, which do you think is a keystone species? Why?

  7. Identify one example of part of the biogeochemical cycle that you observed or would expect to observed in your area.

Now, imagine something about your local ecosystem has changed. For example, let's suppose that one of the species you have identified is removed entirely from the ecosystem.

  1. Which species will you imagine has gone extinct or migrated? If not the same as one identified in the preceding questions, how would you categorize this species with respect to energy flow?

  2. How will the loss of this species affect the ecosystem? Will the ecosystem be viable, will it change, and/or will it collapse?

Species also move, either through normal means or through intentional introduction into different environments. Imagine that an invasive species not yet present in your local area is introduced.

  1. What species not yet present do you suppose is introduced? How would you categorize this species with respect to energy flow?

  2. How will the introduction of this species affect the ecosystem? Will the ecosystem be viable, will it change, and/or will it collapse?

  3. Ecosystems can also change through other impacts of human activity outside of the introduction of a new species. What is an example of a human activity that can directly or indirectly effect your ecosystem? What effect would this activity have?

Project Materials

  • Project worksheet and a pen

  • Access to a local ecosystem—a backyard, local park, or other area with a variety of species

Student Checklist


Chapter 47 Project

A Close Look at Biodiversity

Project Goal + Timeline

In this project, you'll investigate biodiversity at the biochemical level. You'll use an online database to explore diversity in enzymes and metabolic reactions among different species. You'll consider how metabolic diversity relates to ecosystem functioning, and you'll predict the impacts of the loss of certain enzymes on ecosystem health and stability. This project should take between one and two hours to complete.

Directions

The presence of a diverse array of species is important to ecosystem health and stability, not to mention the survival of our own species. While diversity can be assessed through many parameters, you will complete this project by considering biochemical diversity in an ecosystem. You will survey different metabolic pathways and the enzymes they contain to gain insight on their distribution across different species. Some enzymes are widely conserved, while others exist only in select species.

To investigate this diversity, you will utilize the KEGG (Kyoto Encyclopedia of Genes and Genomes) database. This database links metabolic activity and enzymes in an organism to the gene(s) that encode(s) them. There are many ways to explore this resource, but the recommended approach is as follows:

  1. Go to the KEGG PATHWAY Database.

  2. Under "Pathway Maps," select "Metabolism."

  3. Investigate different metabolic pathways by clicking the link for each. After selecting the pathway, you will see a map. In the map, molecules are indicated by their name and a small circle, reactions are indicated by arrows, and enzymes that catalyze the reactions are indicated by an enzyme classifier (EC) number, such as 1.2.7.11.

  4. Select one of the enzymes in the pathway. This will bring you to a table that describes the enzyme in detail, including the enzyme's name, all the pathways in which it is used, and all the genes that encode the enzyme. The genes encoding the enzyme are typically listed in the seventh row of the table.

  5. Investigate the number, type, and diversity of species that have the particular enzyme. There are two ways to conduct this exploration:

    • Select the "UniProt" button at the bottom of the "Genes" section of the table. This will bring you to a list of genes that produce enzymes similar to or the same as the one you are investigating. Perform a text search (using CTRL+F on your keyboard) for the exact name of the enzyme to get a quick count of the number of instances of that exact enzyme on the page. This total will give you an indication of how widespread the enzyme is. For each matching entry, you can click on the name of the gene in the entry to locate the name of the species with the enzyme.

    • You could also select the "Taxonomy" button at the bottom of the "Genes" section of the table. This view shows the relationships among organisms that produce the enzyme, which helps to visualize whether the enzyme is present in many related species or widely dispersed across the tree of life.

Your goal is to survey different types of reactions and pathways to identify three different enzymes. You should find examples of enzymes to fit each of the following:

  • A common enzyme: an enzyme/enzyme-catalyzed reaction present across many different diverse species

  • A rare enzyme: an enzyme/enzyme-catalyzed reaction present in approximately 5 to 10 species

  • A unique enzyme: an enzyme/enzyme-catalyzed reaction present in only 1 to 3 species

Hint: To locate rare and unique reactions, try exploring pathways listed under the sections "1.10 Biosynthesis of other secondary metabolites" or "1.11 Xenobiotics biodegradation and metabolism."

Complete Table 1 for the three enzymes you identified. It may be helpful to consult additional resources from the internet to complete the table.

TABLE 1: Common, Rare, and Unique Enzymes Identified through KEGG
Common Enzyme Rare Enzyme Unique Enzyme
Name of enzyme (blank) (blank) (blank)
Gene(s) that encodes enzyme (blank) (blank) (blank)
Number of species in which the enzyme is found (blank) (blank) (blank)
Description of metabolic reaction in which enzyme participates (blank) (blank) (blank)
White removed (remaining) (blank) (blank) (blank)

Perform some additional research to answer the following questions concerning the rare and unique enzymes you identified in Table 1.

  1. Describe one species with the rare enzyme and one species with the unique enzyme. In what ecosystem(s) is each of these species found?

  2. How does each enzyme, and the metabolic reaction in which it participates, contribute to the survival of each organism/species identified in Question 1?

  3. Do either of the enzymes and their associated metabolic reactions have any relevance to ecosystem health or human health? Explain.

  4. Are any of the species identified in Question 1 endangered? Is the ecosystem in which they live threatened?

  5. Select one of the species (endangered or not). How might human activities (either direct or indirect) affect its survival in the future?

  6. For the species selected in Question 5, how would the loss of the species' enzyme and associated metabolic reaction from the ecosystem affect ecosystem health, functioning, and overall stability?

  7. How does the information in the KEGG database highlight the importance of preserving biodiversity?

  8. How could the information in the KEGG database be used to help preserve biodiversity?

Project Materials

  • Project worksheet and a pen

  • Computer with internet access

  • Access to the KEGG database

Student Checklist